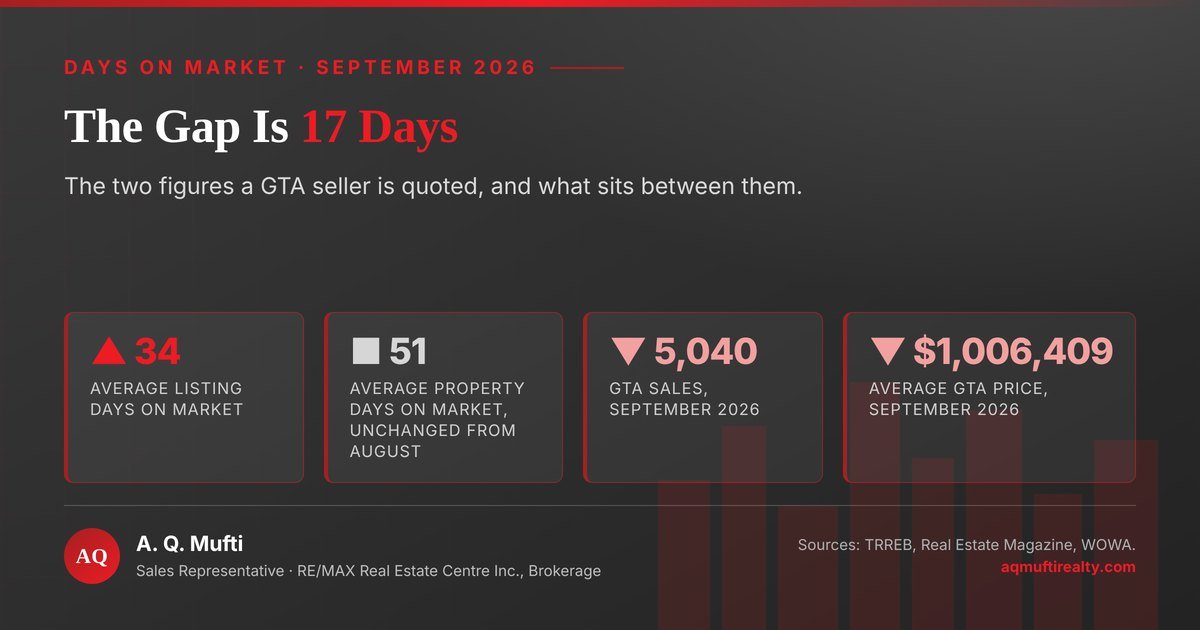
The two days on market figures a GTA seller is quoted, and the gap between them. Source: TRREB September 2026 data. Months of supply calculated.
Ask how long a home takes to sell in the GTA and you will usually get one number. In September 2026 that number was 34.
The trouble is that a second number exists, it is 51, and it describes the same houses. Both are called days on market, and the 17 between them is where sellers lose money.
The short version
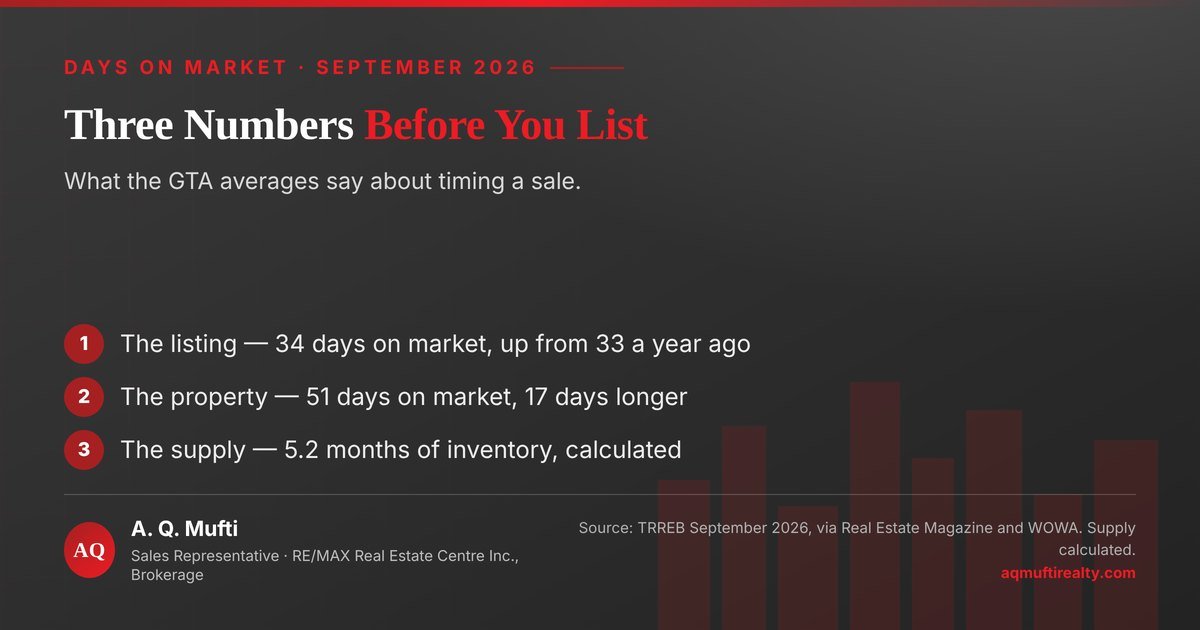
- A listing averaged 34 days on market. That is the figure most sellers hear, and it rose from 33 a year earlier.
- The property averaged 51 days. Same homes, longer clock, because relisting starts a fresh listing.
- The gap is 17 days. Just over two weeks of carrying costs that the shorter figure hides.
- Supply was 5.2 months. There were 26,131 active listings against 5,040 sales (calculated).
- Price for 51, not 34. A plan built on the shorter number runs out before the house sells.
The days on market numbers for September 2026
First, the figures themselves. These are the GTA-wide averages TRREB reported for September 2026, and the two measures sit side by side so the difference is visible.
| Measure | Figure | Source |
|---|---|---|
| Average listing days on market | 34 days | TRREB, via Real Estate Magazine |
| The same measure a year earlier | 33 days | TRREB, via Real Estate Magazine |
| Average property days | 51 days | TRREB, via Real Estate Magazine and WOWA |
| Difference between the two | 17 days | TRREB, via Real Estate Magazine |
| Sales | 5,040 | TRREB |
| New listings | 16,500 | TRREB |
| Active listings at month end | 26,131 | WOWA |
| Months of supply | 5.2 | Calculated |
| Sales as a share of new listings | 30.5% | Calculated |
| Average selling price | $1,006,409 | TRREB |
| Average price change in a year | down 5.1% | TRREB |
| MLS Home Price Index change in a year | down 4.7% | TRREB |
What days on market actually counts
Start with the definitions, because the two figures are not a rounding difference. Indeed they measure different things, and only one of them answers a seller’s real question.
Listing days, the shorter number
The first measure counts from the day a particular listing goes live to the day it sells. In September 2026 that averaged 34 days across the GTA, up from 33 a year earlier, Real Estate Magazine reported from the board’s figures.
So a seller told to expect about five weeks is being given an accurate figure. Instead it answers a narrower question than the one they asked.
Property days, the honest number
The second measure follows the home rather than the paperwork. It also counts relisting by the same seller and brokerage inside the original listing contract period, so the clock carries across.
That figure averaged 51 days in September, and WOWA’s reading of the same release puts it at 51 as well. Two independent reports, one number.
Therefore the two days on market measures differ by 17 days, which is also what the board’s own September averages show. Call it two and a half weeks.
Why days on market resets, and your mortgage does not
Next the mechanism, which is where the money is. Relisting is an ordinary, legitimate thing to do, yet it has one effect nobody mentions.
A fresh listing starts a fresh clock
For example, take a home listed in July that does not sell. The seller and the agent agree to withdraw it, adjust the price, and put it back on the system in August.
That old listing ends. Its replacement begins at zero, so the count starts again from there.
The costs that keep counting
Meanwhile nothing else resets. The mortgage payment, the property tax, the heat, the insurance and the lawn all carry on at the same rate as before.
That is the whole case for planning against the longer figure. In practice, on an average GTA mortgage those 17 days are real money leaving your account for a house you no longer want.
Why the shorter figure is still the one quoted
Partly habit, and partly because listing days are what most reports lead with. Both measures are published, though, so there is no reason to work from only one.
Therefore ask for both when you interview an agent. A clear answer about days on market in your own neighborhood tells you a great deal about how closely they read the data.
What 51 days on market means for your asking price
Now the practical part. In short, a longer honest timeline changes the price you should set, not just the patience you should pack.
The first three weeks do the work
Notably, attention is front-loaded. A new listing reaches the largest audience it will ever have in its opening days, and that window does not come back on a relist.
Price above the market and you spend that window proving it. As a result, by the time the price comes down, the buyers who would have paid fairly have moved on to something else.
Budget for 51 days on market, not 34
Instead, build the plan around the longer figure. If your carrying costs work at seven weeks but not at five, the asking price is doing too much of the work.
Of course a well-priced home can sell in a week, and some do. Even so, a plan which only survives the best case is not much of a plan.
A price cut is not a reset
Dropping the price inside a live listing keeps the clock running, which some sellers dislike. Withdrawing and relisting hides the history on the listing days on market figure, but it changes nothing a buyer’s agent cannot look up.
Admittedly the newer sheet looks cleaner. In practice, experienced buyers ask how long the home has been for sale, not how long the current listing has existed.
Days on market against the rest of the September market
Then there is the background, which explains why the figures sit where they do. Certainly September was a slower month on almost every measure.
Supply, in months
There were 26,131 active listings at the end of September against 5,040 sales, which works out to 5.2 months of supply (calculated). Consequently, at that pace the standing inventory would take most of a selling season to clear.
New listings totalled 16,500, so sales came to 30.5% of them (calculated). Roughly one sale for every three homes newly offered.
Prices, and what they say about days on market
The average selling price was $1,006,409, down 5.1% in a year, with the MLS Home Price Index down 4.7%, TRREB reported on October 6.
Equally, sales were down 9% and new listings down 14.4%. Both sides of the market stepped back, and a longer days on market figure is what that looks like from a seller’s driveway.
What the board expects next
TRREB’s chief information officer Jason Mercer pointed to “substantial pent-up demand in the GTA” in the same release. Even so, whether it arrives this winter, nobody can say.
Either way the figures above are the ones in front of you today, and they are the ones to price against.
How to plan around days on market before you list
Finally, what to do with all this. Five steps, in the order they matter.
- Ask for both figures. Your agent should be able to give listing and property days on market for your street, not just the GTA average.
- Price for the longer one. Check that your carrying costs survive seven weeks, not five.
- Spend the first window well. Photography, repairs and decluttering are worth more before the listing goes live than after.
- Treat a relist as a last resort. Likewise it shortens the number on the sheet, not the time the house has been for sale.
- Review at three weeks, not three months. Indeed, if the showings have stopped, the market has given you its answer.
Where I can help
I will put your own numbers beside the averages. My home valuation gives you a price range, the monthly market updates track the figures above as they move, my mortgage calculator prices the carrying cost of an extra few weeks, and the guide for buyers covers the purchase on the other side of the sale.
In addition, for the rules your agent works under, the Real Estate Council of Ontario publishes what a registrant owes you. Worth ten minutes before you sign anything.
Your questions on days on market
Short answers to what sellers in Mississauga, Oakville and Milton ask me most often about timing a sale.
Which days on market figure should I trust?
Both, for different jobs. Listing days on market tells you how long the current listing has run; property days tells you how long the home has been for sale. Plan your costs against the longer one.
Does relisting hurt my sale?
It resets the shorter figure and nothing else. Buyers and their agents can see the history, so the benefit is cosmetic while the carrying costs continue.
Is 51 days on market slow for the GTA?
It is slower than it has been, and it was unchanged from August 2026. With 5.2 months of supply (calculated) it is what a market with more listings than buyers produces.
Should I wait for spring to sell?
Of course nobody can promise spring will be better. Prices were down 5.1% in a year and listings down 14.4%, so fewer homes competed with yours in September than a year earlier.
How fast should a well-priced home sell?
Again, there is no guaranteed figure, which is why the averages are useful. If three weeks pass with no offers and showings have dried up, the price is the most likely reason.
Sources and further reading
- September 2026 market release, from TRREB — sales and prices
- The September days-on-market figures, from Real Estate Magazine — the two measures
- The same release read by WOWA — the cross-check
- Market data, from TRREB — the monthly figures
- What a registrant owes you, from RECO — your protections
Keep reading on the blog
More guides and market analysis from this blog.
- Pricing a GTA Home in a Balanced Market — setting the number
- Renovations That Add Value in the GTA — before you list
- GTA Home Sales, September 2026 — the full month
- The Principal Residence Exemption in Ontario — tax on the sale
Ready to find out what your street is doing?
Tell me your address and roughly when you want to move, and I will send you the listing and property figures for your own pocket of Mississauga, Oakville or Milton beside a price range. No pressure, and no obligation.
Prefer to start with a number? Get a tailored home valuation or run the figures in the mortgage calculator.
Disclaimer: This article draws on TRREB’s September 2026 market release and on the timing figures from that release as reported independently by Real Estate Magazine and WOWA, both fetched on October 29, 2026. It offers information only. I calculated the months of supply and the share of new listings sold from the monthly totals, and labelled them. Averages describe the whole GTA and not your street, so figures for one home can differ sharply. Nothing here is tax, legal or financial advice. A. Q. Mufti – Sales Representative, RE/MAX Real Estate Centre Inc., Brokerage.
A. Q. Mufti — Sales Representative
RE/MAX Real Estate Centre Inc., Brokerage
MSc, PMP®, ABR®, SRS®, CNE®
416 908 5600 · 905 270 2000
info@aqmuftirealty.com
141-1140 Burnhamthorpe Rd. W., Mississauga ON L5C 4E9
Serving Mississauga, Oakville, Milton, Brampton, Toronto and the wider GTHA. More about how I work.