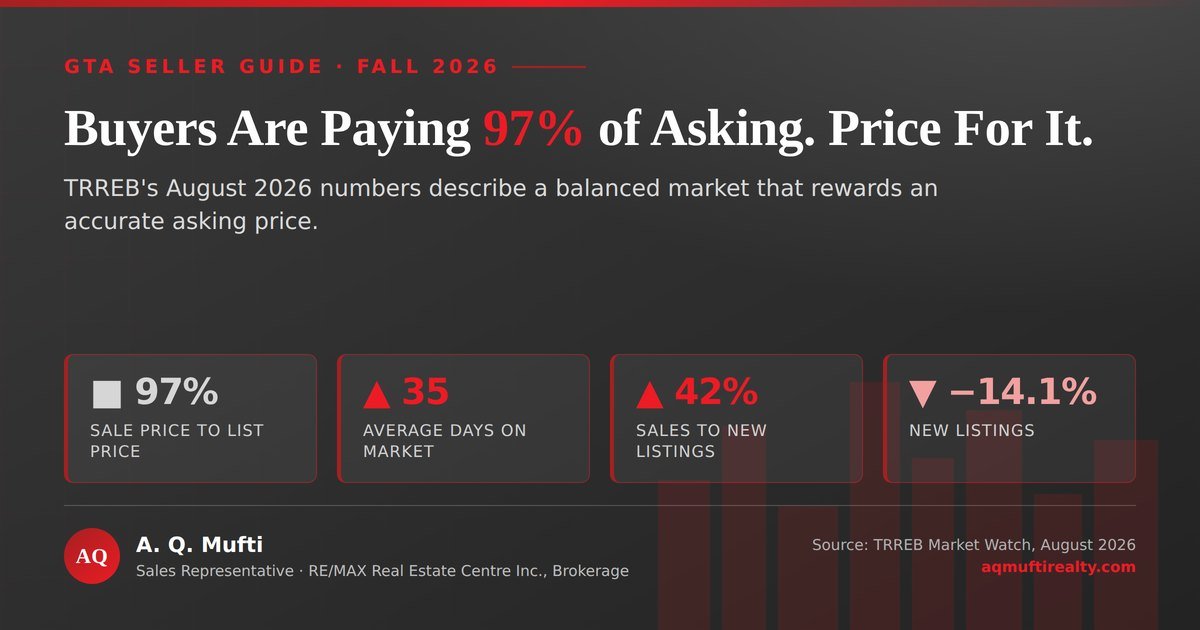
Most sellers pick a number before they pick a GTA home pricing strategy. They start from what a neighbour got in 2022, subtract a little, and hope. That habit is expensive right now. In August 2026 the average home across the Toronto region sold for 97% of its asking price, and it took 35 days to get there.
Read those two numbers together and the market speaks clearly. Buyers are willing. However, they are not in a hurry, and they are not paying a premium for optimism. So the asking price is doing almost all of the work.
This guide sets out how to choose that number. First it explains what the August data actually says. Then it turns the three figures that matter into a method you can apply to your own home this autumn.
The short version
- Buyers pay near asking, not above it. Any GTA home pricing strategy starts here: the average sale closed at 97% of list price in August, exactly as it did a year earlier.
- Speed depends on the first price. Homes averaged 35 days on market in August, against 33 days a year earlier.
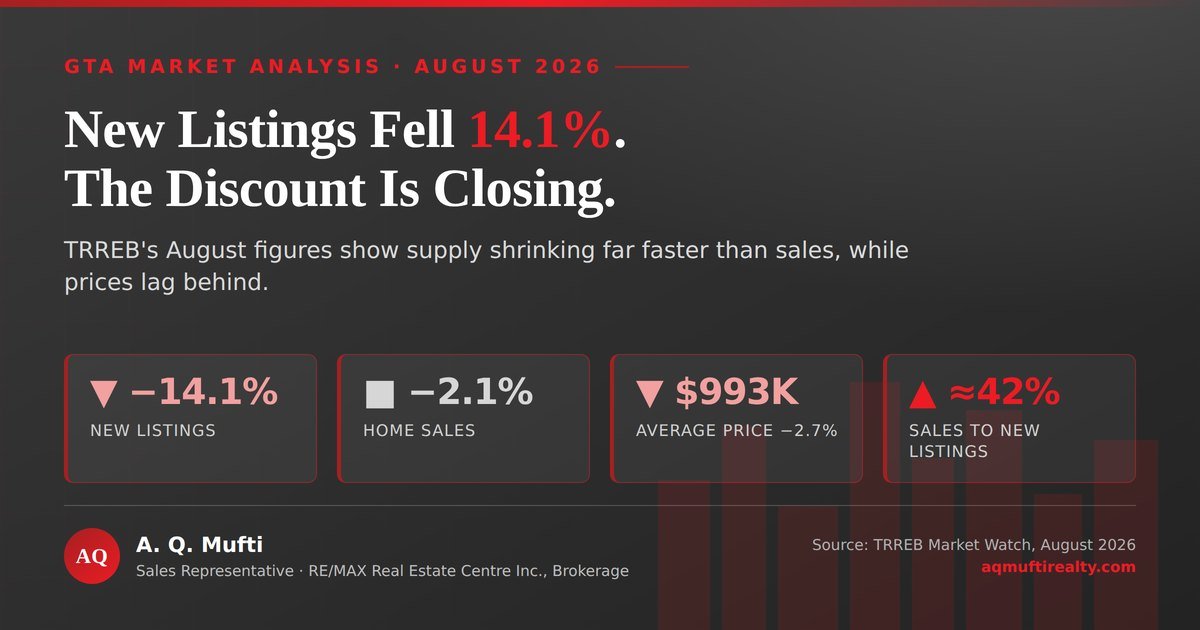
- Supply is thin and the market is balanced. New listings fell 14.1%, and sales absorbed about 42% of them (calculated).
- Prices drifted down, not off a cliff. The average price was $993,410, down 2.7%, while the benchmark fell 4.5%.
- Borrowing costs are steady. The Bank of Canada held at 2.25% on 2 September, so your buyer’s budget is predictable.
The August 2026 numbers behind a GTA home pricing strategy
Here is what the Toronto Regional Real Estate Board reported for August, with the same month a year earlier alongside it.
| Measure | August 2026 | August 2025 | Change |
|---|---|---|---|
| Home sales | 5,057 | ≈5,166 | −2.1% |
| New listings | 12,075 | ≈14,057 | −14.1% |
| Average selling price | $993,410 | ≈$1,020,976 | −2.7% |
| MLS® HPI Composite benchmark | — | — | −4.5% |
| Average sale price to list price | 97% | 97% | unchanged |
| Average days on market | 35 | 33 | +2 days |
| Sales-to-new-listings ratio | ≈41.9% | ≈36.7% | +5 points |
What a 97% sale-to-list ratio means for your GTA home pricing strategy
The sale-to-list ratio is the plainest measure in the report. Divide what a home sold for by what it was asking. In August the regional average came to 97%, which means the typical seller accepted roughly three per cent below their number.
On the average GTA sale of $993,410, three per cent is about $29,800 (calculated). That is real money. Yet the same ratio stood at 97% a year earlier too, so buyer behaviour has not shifted at all, even while the benchmark fell 4.5%.
Therefore the story is not weakness. It is discipline. Buyers will meet a fair price quickly and ignore an unfair one entirely. Jason Mercer, TRREB’s Chief Information Officer, put the affordability side of it this way: “Ownership housing in the GTA has remained relatively affordable over the past year, with average prices dipping and mortgage rates remaining somewhat flat.”
Why the regional average is not your average
Averages hide enormous spread. Among freehold homes alone, detached properties averaged $1,288,669 across the region in August. Semi-detached homes came in at $931,665, and townhouses at $882,060.
So the 97% figure is a behaviour, not a price. It describes how buyers respond to an asking price, whatever the property type. Use it as a discount you should not need to give, rather than as a discount you must plan for.
Build your GTA home pricing strategy on three numbers
Three figures from the August report do almost all the work. Take them in order, because each one answers a different question about your listing.
- Sale to list price, 97%. This sets your expectation for the gap between asking and closing. Price so that three per cent below still works for you.
- Days on market, 35. This sets your patience. A correctly priced home in this market is not a weekend event, and it is not a six-month campaign either.
- Sales to new listings, about 42%. This sets the temperature. Roughly 40% to 60% is a balanced market, so neither side holds all the leverage (calculated).
Put together, they describe a market that rewards accuracy. Last August homes moved in 33 days, so buyers have grown only marginally more patient. Meanwhile new listings fell 14.1%, which means you face fewer direct competitors than you did a year ago.
Why the first three weeks decide the sale
The 35-day average conceals a pattern every agent sees. Interest is front-loaded. A new listing reaches the largest audience in its opening days, because it lands in saved searches and alerts the moment it goes live.
Consequently, an asking price that scares off that first wave is expensive to undo. The home sits, the listing ages, and buyers who arrive later ask what is wrong with it. Rather than test a high number and correct later, price into that opening window and let competition do the correcting.
A GTA home pricing strategy built for how buyers search
Buyers do not browse. They filter. Someone searching up to $900,000 will never see a home listed at $910,000, however well it shows. So a sound GTA home pricing strategy respects round numbers even when the valuation sits awkwardly between them.
Sitting just above a threshold is the most common unforced error. Ten thousand dollars of ambition can cut your audience sharply, because the filters most buyers set cluster on hundred-thousand boundaries. Conversely, pricing just under a threshold pulls in every buyer who set that ceiling.
There is a second timing point. Listings that launch in early autumn compete with very little, since new listings are down and many owners have already decided to wait for spring. Wait with them and you compete with all of them at once.
Start from evidence rather than instinct. A current valuation of your home gives you the comparable sales, and my preparation guide for sellers covers the order to do things in.
Your GTA home pricing strategy in Mississauga and Peel
Regional averages are useful, but you are selling in one market. In August, Peel Region recorded 940 sales at an average price of $908,415. The City of Mississauga accounted for 435 of those sales, at an average of $898,510.
Notably, both Peel and Mississauga posted the same 97% sale-to-list ratio as the wider region. Buyer behaviour here matches the GTA pattern almost exactly, so the regional rule of thumb travels well into local pricing decisions.
Still, a street is not a city. Two similar homes a kilometre apart can sit in different school catchments, different transit walksheds and different price bands. That is where comparable sales earn their keep.
The rate backdrop your buyer is working with
On 2 September the Bank of Canada held its policy rate at 2.25%, with the Bank Rate at 2.5% and the deposit rate at 2.20%. Economic growth reached 3.3% in the second quarter, and the unemployment rate was 6.4% in July.
Inflation hovered around 3% in recent months. Excluding gasoline it was 2.2%, and measures of core inflation stayed close to 2% in July. The Bank pointed to energy costs, noting that “the continuing conflict in the Middle East is keeping energy prices high.”
For a seller, the practical meaning is stability. Your buyer’s borrowing costs have not moved since the spring, so their budget is a known quantity rather than a moving target. They can commit, and they will not blame a rate change for walking away. Buyers can check their own figures in the payment calculator before they offer.
Two decisions remain this year: 28 October and 9 December. October carries a Monetary Policy Report, which usually moves expectations more than the rate itself. Listing before that date means selling into a settled market.
TRREB president Daniel Steinfeld framed the balance of risk for buyers directly:
If inventory tightens and home prices begin to rise, some buyers may face a trade-off between waiting for greater economic certainty and purchasing before prices move higher.
Daniel Steinfeld, President, Toronto Regional Real Estate Board
That pressure works in your favour, but only at a credible asking price. A good GTA home pricing strategy converts thin competition into a fast, clean sale instead of a long, discounted one.
Your GTA home pricing strategy questions, answered
Short answers to what sellers across Mississauga and the GTA are asking me this month.
Should a GTA home pricing strategy start high and negotiate down?
Rarely, and not in this market. The average sale closed at 97% of asking, so buyers already expect a small gap. Price well above the evidence and you lose the first three weeks of attention, which are the weeks that matter most.
How long should my home take to sell?
Around 35 days was the regional average in August, up from 33 a year earlier. Treat five weeks as normal. If you pass that mark with little activity, the price is usually the cause rather than the photography or the season.
What does the sales-to-new-listings ratio mean for me?
It divides the month’s sales by the month’s new listings, so it shows how much fresh supply buyers absorb. Roughly 40% to 60% is balanced. August came in near 42% (calculated), so neither side can dictate terms.
Is it better to list now or wait for spring?
Autumn brings less competition. New listings fell 14.1% year over year, so your home stands out more now than it will in March. Spring brings more buyers, but it also brings every seller who decided to wait.
Why did the benchmark fall more than the average price?
The MLS Home Price Index tracks a consistent type of home, while the average simply divides total dollars by total sales. In August the benchmark fell 4.5% and the average fell 2.7%. The gap reflects which homes sold, not a contradiction.
What if my home was listed once before this year?
Then treat the relaunch as a fresh launch. Buyers who saw the first attempt need a reason to look again, and the strongest reason is a credible price. Change the number, the presentation and the story together rather than one at a time.
Sources and further reading
- TRREB — A Noticeable Dip in GTA Home Sales and Listings — August 2026 Market Watch release
- TRREB — Market Watch, August 2026 (PDF) — days on market, inventory and sale-to-list detail
- Bank of Canada — policy rate held at 2.25% — 2 September 2026 decision
- Bank of Canada — 2026 announcement schedule — remaining dates: 28 October and 9 December
Keep reading on the blog
More market analysis and practical guides from this blog.
- What Buyers Must Do Now in the Fall Market — the other side of the same market
- GTA Housing Market Report – June 2026 — where this year’s supply squeeze began
- Five Reasons Buyers Must Act Now – May 2026 — how the spring market set up this autumn
- Ten Essential Steps for First-Time Buyers in Mississauga — useful if you are buying as well as selling
Ready to price your home properly?
A sound GTA home pricing strategy starts with your street, not with a regional average. Let us walk through your comparable sales, your timeline and the number that gets you sold this autumn. No pressure, and no obligation.
Prefer to start with a number? Get a tailored home valuation or run the figures in the mortgage calculator.
Disclaimer: This analysis draws on the TRREB Market Watch release for August 2026 and Bank of Canada publications, and it is provided for information only. It is not financial, mortgage or legal advice, and market conditions change. A. Q. Mufti is a registered Sales Representative with RE/MAX Real Estate Centre Inc., Brokerage, Ontario, Canada.
A. Q. Mufti — Sales Representative
RE/MAX Real Estate Centre Inc., Brokerage
MSc, PMP®, ABR®, SRS®, CNE®
416 908 5600 · 905 270 2000
info@aqmuftirealty.com
141-1140 Burnhamthorpe Rd. W., Mississauga ON L5C 4E9
Serving Mississauga, Oakville, Milton, Brampton, Toronto and the wider GTHA. More about how I work.