Category: Blog

Your blog category

  • GTA Real Estate Fall 2026: What Buyers Must Do Now

    GTA Real Estate Fall 2026: What Buyers Must Do Now

    GTA real estate fall 2026 infographic showing TRREB July data: sales down 0.9 per cent, new listings down 17.8 per cent, average price $1,003,956 down 4.5 per cent, and the sales-to-new-listings ratio tightening to 41 per cent. Toronto housing market analysis by A. Q. Mufti, RE/MAX Mississauga.
    GTA real estate fall 2026 at a glance. Prices are still below last year, but supply fell far faster than demand. Source: TRREB Market Watch, July 2026.

    Something quiet but important has shifted in the GTA real estate fall 2026 market. Prices are still lower than a year ago, so the headlines read like a buyer’s market. Yet underneath those headlines, the supply of homes for sale has collapsed. In July, sellers listed 17.8% fewer properties than in July 2025, while sales barely moved. That gap is the whole story.

    Because fewer homes compete for the same buyers, the discount you can negotiate is shrinking month by month. Daniel Steinfeld, President of the Toronto Regional Real Estate Board, put it plainly: “With sales accounting for a larger share of listings, buyers may find there is less room to negotiate moving forward.”

    So this article does two things. First, it walks through the July numbers and what they actually mean. Then it sets out the specific moves worth making before the Bank of Canada speaks again on September 2.

    The short version

    • Prices are down, supply is down more. Average price fell 4.5% year over year. New listings fell 17.8%.
    • The market is tightening fast. The Toronto housing market’s sales-to-new-listings ratio jumped from roughly 34% to about 41% in twelve months.
    • Rate cuts are likely finished. The Bank of Canada has left the rate at 2.25% through its recent decisions, and RBC now expects the next move to be up.
    • Negotiating room is closing. TRREB’s own president warns buyers will find less of it from here.
    • The window is months, not years. Buy while prices lag and competition is still thin.

    July 2026 in numbers

    Here is what the Toronto Regional Real Estate Board reported for the month, with last year’s figures for comparison.

    MeasureJuly 2026July 2025Change
    Home sales5,9956,049 (est.)down 0.9%
    New listings14,48417,620 (est.)down 17.8%
    Average selling price$1,003,956$1,051,262 (est.)down 4.5%
    MLS® HPI Composite benchmarknot publishednot publisheddown 4.6%
    Sales-to-new-listings ratioabout 41%about 34%up 7 points
    Bank of Canada policy rate2.25%2.75%down 0.50%
    Source: TRREB Market Watch, July 2026, and the Bank of Canada. TRREB reports the current month and the percentage change; the July 2025 figures marked (est.) are calculated back from those percentages, so treat them as close approximations.

    Why the discount is shrinking even though prices fell

    At first glance, the two facts look contradictory. Prices are down 4.5% and the benchmark is down 4.6%, so surely buyers hold the cards. But price is a lagging measure. It tells you what closed sixty to ninety days ago. Supply and demand tell you what happens next.

    The cleanest way to read that balance is the sales-to-new-listings ratio. Divide the month’s sales by the month’s new listings. Below about 40%, the market favours buyers. Above roughly 60%, it favours sellers. Between those two lines, it is balanced.

    In July 2025, that ratio sat near 34%, which is a genuine buyer’s market. Twelve months later, it reached about 41%. So the GTA has already climbed out of buyer’s territory and into balance. Meanwhile, the price data has not caught up yet, and that lag is exactly the opportunity.

    With sales accounting for a larger share of listings, buyers may find there is less room to negotiate moving forward.

    Daniel Steinfeld, President, Toronto Regional Real Estate Board

    Why sellers stepped back

    Many owners who listed in 2024 and 2025 did not sell at the price they wanted. Instead of cutting further, they pulled the listing and waited. Others refinanced and stayed put. As a result, the resale pool thinned out sharply, and builders slowed new projects at the same time.

    That matters because supply cannot be rebuilt quickly. A seller who decides in September to list will complete in October or November at the earliest. So the shortage you see today is largely locked in for this autumn.

    The rate story changed in July

    On 15 July, the Bank of Canada held its overnight rate at 2.25%, with the Bank Rate at 2.5%. That extends the hold in place through the spring and summer. The Bank also noted that CPI inflation rose to 3.2% in May, largely on higher gasoline prices, and it expects inflation to return to around 2% in early 2027.

    Jason Mercer, TRREB’s Chief Information Officer, framed the mood well: “While uncertainty about the economy and borrowing costs persists, recent news has been more positive than expected.” Growth reached an estimated 2.5% in the second quarter, which is stronger than most forecasters pencilled in.

    Here is the part buyers should not miss. RBC Economics now argues that the cutting cycle is over, and that “the next change in interest rates is more likely to be a hike.” After 275 basis points of cuts since June 2024, the cheap-money tailwind has stopped blowing.

    Therefore, the calculation has flipped. Waiting used to buy you a lower rate. Now waiting mostly buys you more competition, because every month of steady rates pulls more sidelined buyers back in. The next decision lands on 2 September 2026.

    For anyone weighing a purchase in the GTA real estate fall 2026 market against another year of renting, that shift matters more than any single monthly price print. Borrowing costs have stopped improving. Supply has stopped growing. Only the price data still points backwards.

    What GTA real estate fall 2026 means if you are buying

    You are shopping in a narrow, unusual window of the Toronto housing market. Prices still reflect a soft spring. Competition reflects a tightening summer. Those two things rarely sit together for long.

    Practically, that means three things. First, your negotiating leverage is real but fading, so use it now rather than in December. Second, inventory is thin, so the good listings move quickly and you need financing arranged before you view. Third, a hold at 2.25% is a known quantity, and you can budget against it with some confidence.

    Five moves worth making this month

    1. Get a real pre-approval, not an online estimate. Hold the rate for 90 to 120 days so a September surprise cannot reprice your budget.
    2. Stress-test one rate higher. Run your payment at plus one percentage point in the payment calculator so a future hike is an inconvenience, not a crisis.
    3. Look where the discount is deepest. Condo apartments still carry the largest gap between asking and closing prices across the region.
    4. Write cleaner offers, not just lower ones. With fewer listings, a firm closing date and a tidy deposit often beat another five thousand dollars.
    5. Decide your walk-away number in advance. Balanced markets punish hesitation and reward preparation in roughly equal measure.

    If you are buying for the first time, the sequencing matters more than the tactics. My step-by-step guide for buyers sets out the order to do things in, and the home finder will alert you when a matching listing appears.

    What it means if you are selling

    Sellers have the opposite problem in this Toronto housing market, and it is a nicer one. You face less competition than at any point in two years. However, buyers are still price-sensitive, and the benchmark is down 4.6%, so an ambitious list price will still sit.

    So price to the current market rather than to the 2022 peak. Then let the shortage of alternatives do the work. Homes that are priced correctly and presented well are drawing multiple offers again in several Mississauga and Oakville pockets, which was not true in March.

    One timing note. If you list in early autumn, you compete with very little. Wait for spring instead, and you compete with everyone else who waited. Start with a current valuation of your home and work backwards from there. My guide for sellers covers the preparation sequence in more detail.

    In short, the GTA real estate fall 2026 market rewards whichever side moves first. Buyers still have a price advantage. Sellers have a scarcity advantage. Both advantages shrink as the market moves back toward balance.

    Your questions about the fall market, answered

    Short answers to what buyers and sellers are asking me most this month.

    Q – Is the GTA still a buyer’s market in fall 2026?

    A – Only just. The sales-to-new-listings ratio reached about 41% in July, up from roughly 34% a year earlier. Below 40% is a buyer’s market, so the region has effectively moved into balanced territory. Prices simply have not caught up yet.

    Q – Will prices fall further before they recover?

    A – Nobody can promise a bottom. But the mechanism that pushed prices down was abundant supply, and that supply has fallen 17.8% year over year. When listings drop that sharply while sales hold flat, continued price declines become much harder to sustain.

    Q – Should I wait for another rate cut before I buy?

    A – That was a reasonable plan a year ago. It is a weaker one now. The Bank has left the rate at 2.25% through its recent decisions, and RBC Economics expects the next move to be a hike rather than a cut. Waiting for a cut that may never arrive costs you the thin competition you enjoy today.

    Q – What does the sales-to-new-listings ratio actually tell me?

    A – It measures how much of the month’s fresh supply gets absorbed by buyers. Under 40% means sellers are competing for you. Over 60% means you are competing for homes. It turns before prices do, which is why it is the single most useful number in a monthly report.

    Q – Which property type offers the best value right now?

    A – Condo apartments still show the widest gap between listing prices and what buyers actually pay, so the negotiating room is deepest there. Detached homes in Mississauga and Oakville have tightened faster, and several pockets are already seeing competing offers again.

    Q – How should I prepare for the September 2 rate decision?

    A – Lock a pre-approval before the announcement and make sure the hold runs at least 90 days. Then run your payment at one point higher than your quoted rate. If that number still works, a hold or a hike will not derail your plans either way.

    Sources and further reading

    Keep reading on the blog

    More market analysis and practical guides from this blog.

    Ready to move on the fall market?

    The numbers behind the GTA real estate fall 2026 market point one way: less choice, firmer prices, and a shorter runway than most buyers assume. Let us look at your budget, your neighbourhood and your timeline together, and decide what actually makes sense for you. No pressure, and no obligation.

    Prefer to start with a number? Get a tailored home valuation or run the figures in the mortgage calculator.

    Disclaimer: This analysis draws on the TRREB Market Watch release for July 2026 and Bank of Canada publications, and it is provided for information only. It is not financial, mortgage or legal advice, and market conditions change. A. Q. Mufti is a registered Sales Representative with RE/MAX Real Estate Centre Inc., Brokerage, Ontario, Canada.


    A. Q. Mufti — Sales Representative

    RE/MAX Real Estate Centre Inc., Brokerage
    MSc, PMP®, ABR®, SRS®, CNE®
    416 908 5600 · 905 270 2000
    info@aqmuftirealty.com
    141-1140 Burnhamthorpe Rd. W., Mississauga ON L5C 4E9

    Serving Mississauga, Oakville, Milton, Brampton, Toronto and the wider GTHA. More about how I work.
  • GTA Housing Market Report – June 2026 – Time To Act Now

    GTA Housing Market Report – June 2026 – Time To Act Now

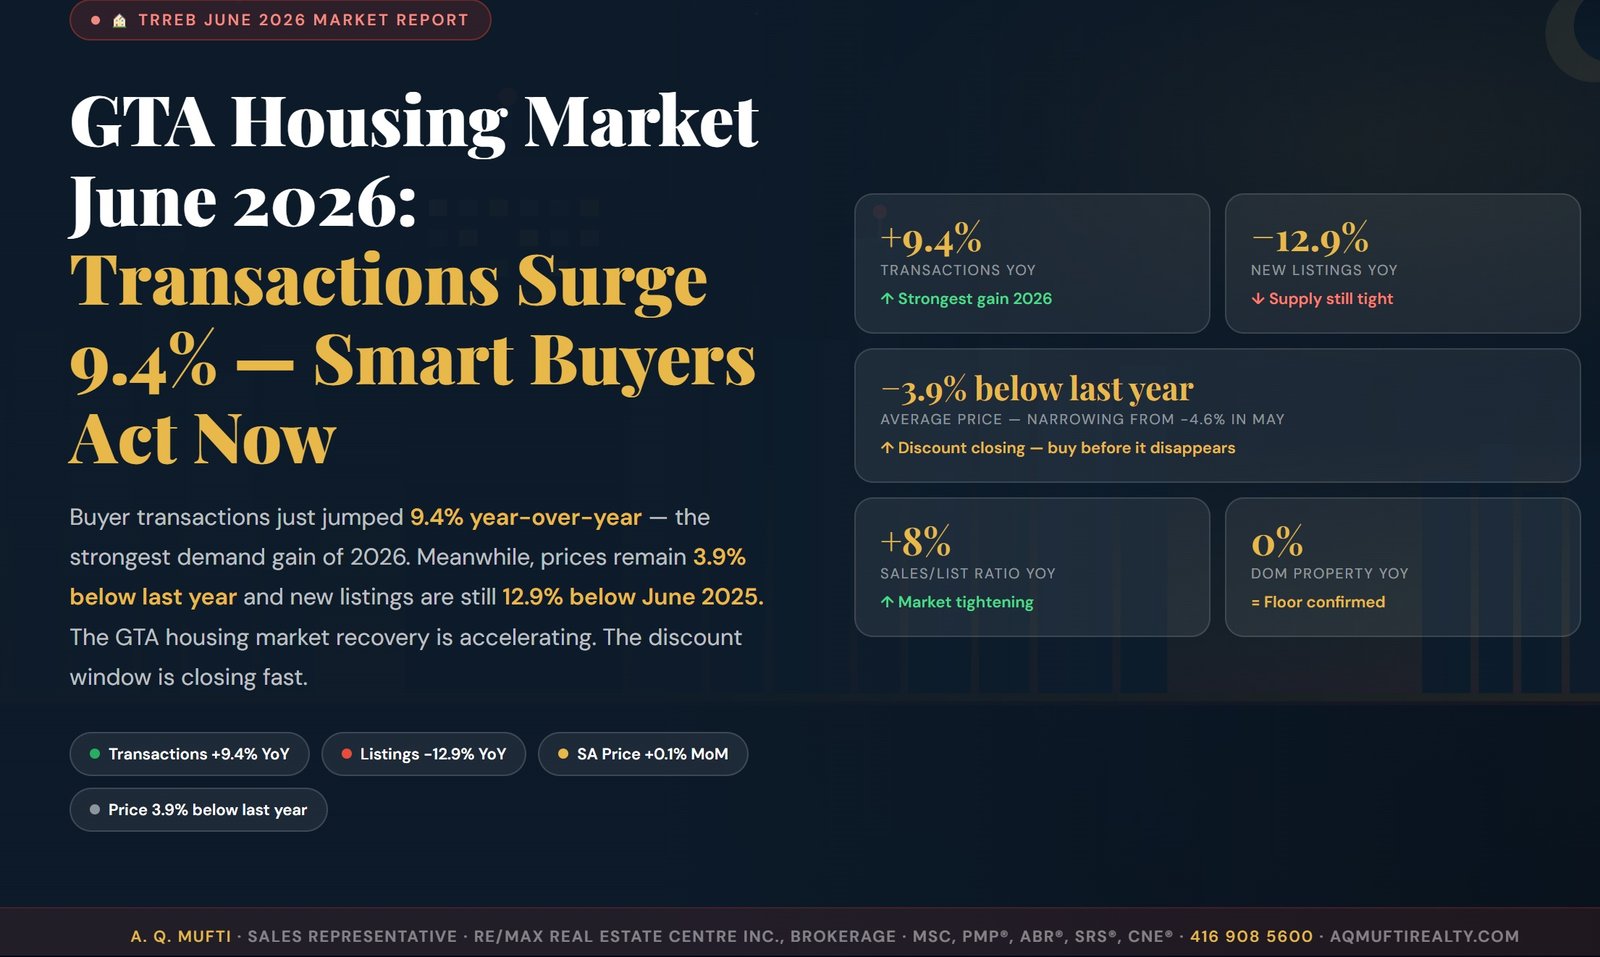
    The GTA housing market in June 2026 delivered its most powerful demand signal of the entire recovery cycle. Buyer transactions surged 9.4% year-over-year — accelerating sharply from the 6.3% gain recorded in May. Furthermore, the GTA housing market price discount is actively narrowing: from −4.6% year-over-year in May to −3.9% in June. The recovery is not approaching — it is already here.

    Moreover, the GTA housing market continues to face a supply constraint that is simply not resolving. New listings remain 12.9% below last year — and the sales-to-new-listings ratio rose 8% year-over-year. Consequently, the fundamental supply-demand imbalance driving GTA housing market price recovery is intensifying, not easing. Additionally, days on market for properties is now flat year-over-year, confirming the correction period is definitively over.

    What This Report Covers: Your Complete June 2026 GTA Housing Market Breakdown

    Below, I break down every KPI from the TRREB June 2026 Quick Market Overview — residential, commercial, condo, and rental — with clear, actionable guidance for GTA housing market buyers and sellers. Additionally, each section includes a direct month-over-month comparison to May 2026 so you can see the direction of momentum, not just the snapshot.

    📅 Published: July 7, 2026  ·  ✍️ A. Q. Mufti, Sales Representative · RE/MAX Real Estate Centre Inc., Brokerage  ·  📍 Mississauga, GTA  ·  ⏱ 9 min read

    Watch: June 2026 GTA Housing Market Update

    Prefer to watch? This 2-minute video covers the three biggest June 2026 GTA housing market signals and what they mean for your next move.

    GTA Housing Market Update — June 2026

    A. Q. Mufti · RE/MAX Real Estate Centre Inc. · 2 min 30 sec

    To activate: record a 2–3 min walkthrough of the data below and paste your YouTube or Vimeo embed code where the play button sits above.
    📊 Residential Market Snapshot

    June 2026 GTA Housing Market: Eight Numbers That Define the Recovery

    Each metric drawn directly from the TRREB June 2026 Quick Market Overview — compared to May 2026 to show the momentum.

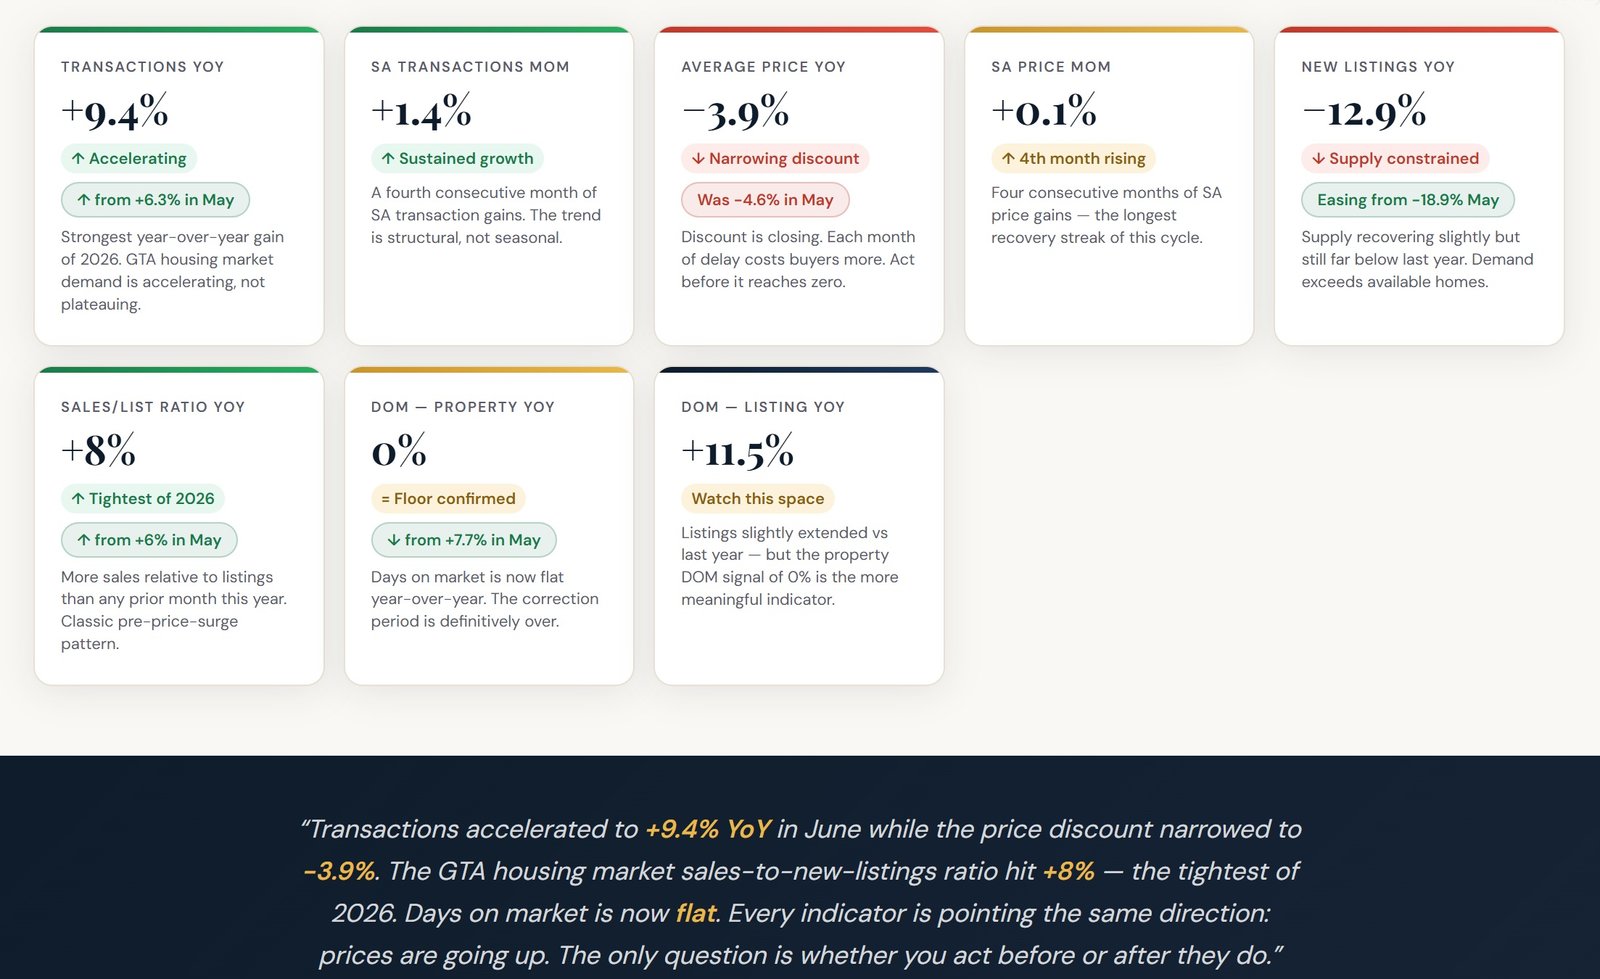
    Transactions YoY
    +9.4%
    ↑ Accelerating
    ↑ from +6.3% in May
    Strongest year-over-year gain of 2026. GTA housing market demand is accelerating, not plateauing.
    SA Transactions MoM
    +1.4%
    ↑ Sustained growth A fourth consecutive month of SA transaction gains. The trend is structural, not seasonal.
    Average Price YoY
    −3.9%
    ↓ Narrowing discount
    Was −4.6% in May
    Discount is closing. Each month of delay costs buyers more. Act before it reaches zero.
    SA Price MoM
    +0.1%
    ↑ 4th month rising Four consecutive months of SA price gains — the longest recovery streak of this cycle.
    New Listings YoY
    −12.9%
    ↓ Supply constrained
    Easing from −18.9% May
    Supply recovering slightly but still far below last year. Demand exceeds available homes.
    Sales/List Ratio YoY
    +8%
    ↑ Tightest of 2026
    ↑ from +6% in May
    More sales relative to listings than any prior month this year. Classic pre-price-surge pattern.
    DOM — Property YoY
    0%
    = Floor confirmed
    ↓ from +7.7% in May
    Days on market is now flat year-over-year. The correction period is definitively over.
    DOM — Listing YoY
    +11.5%
    Watch this space Listings slightly extended vs last year — but the property DOM signal of 0% is the more meaningful indicator.

    “Transactions accelerated to +9.4% YoY in June while the price discount narrowed to −3.9%. The GTA housing market sales-to-new-listings ratio hit +8% — the tightest of 2026. Days on market is now flat. Every indicator is pointing the same direction: prices are going up. The only question is whether you act before or after they do.”

    June 2026 GTA Housing Market — Full Data at a Glance

    The infographic below summarizes all key June 2026 TRREB metrics. Furthermore, it shows the month-over-month improvement from May — confirming the GTA housing market recovery is gaining momentum, not stalling.

    Figure 1: TRREB June 2026 GTA housing market data summary with May 2026 comparison — A. Q. Mufti, RE/MAX Real Estate Centre Inc., Brokerage · Mississauga, ON

    GTA housing market June 2026 infographic — TRREB data showing transactions plus 9.4 percent year-over-year, new listings minus 12.9 percent, average price minus 3.9 percent, and DOM flat at zero percent, all metrics improving from May 2026. Analysis by A. Q. Mufti RE/MAX Mississauga
    📈 Charts

    June 2026 GTA Housing Market — Momentum Visualized

    GTA Housing Market — Year-over-Year % Change · June 2026 vs June 2025
    Source: TRREB Quick Market Overview · June 2026 · Arrows show change from May 2026
    Transactions YoY ↑
    +9.4% (was +6.3% May)
    Sales/List Ratio ↑
    +8% (was +6% May)
    SA Transactions
    +1.4% MoM
    SA Price MoM
    +0.1% (4th month ↑)
    DOM Property ↑
    0% flat (floor!)
    Avg Price YoY ↑
    −3.9% (was −4.6% May)
    New Listings YoY ↑
    −12.9% (was −18.9% May)
    GTA Housing Market Recovery Trajectory — March to June 2026
    Transaction YoY growth accelerating every month · Price discount narrowing every month
    0% 3% 6% 9% 12% Mar 2026 Apr 2026 May 2026 Jun 2026 ~+3% +7% +6.3% +9.4% — Transactions YoY (left axis)    — Price recovery trajectory (improving) −5.5% −4.9% −4.6% −3.9% Transaction YoY growth (accelerating) Price YoY gap closing (improving)
    🔍 Analysis

    Six GTA Housing Market Signals Decoded for June 2026

    Each signal below is drawn directly from TRREB June 2026 data. Furthermore, each one compared to May confirms the GTA housing market recovery is accelerating.

    📈

    Transactions Accelerated — Not Peaked

    June 2026 GTA housing market transactions rose 9.4% year-over-year — up from 6.3% in May and approximately 7% in April. Furthermore, this three-month acceleration pattern is the clearest confirmation that buyer demand is structural, not seasonal. Consequently, those waiting for demand to plateau before buying are waiting for something that is moving in the opposite direction. Moreover, as supply stays constrained, this acceleration will only intensify through Q3.

    💰

    Price Discount Closing — From 4.6% to 3.9%

    Average GTA housing market price narrowed from −4.6% year-over-year in May to −3.9% in June — a meaningful 0.7 percentage point improvement in a single month. Moreover, on an $800,000 home, that gap represents $5,600 more in purchase price than one month earlier. Therefore, every month of delay carries a measurable and accelerating dollar cost. Additionally, at the current closure pace, the discount reaches zero by Q3 2026.

    📊

    Sales/List Ratio Hit +8% — Tightest of 2026

    GTA housing market sales-to-new-listings ratio rose 8% year-over-year in June — improving from +6% in May. Consequently, more sales are occurring per available listing than at any point this year. Furthermore, this metric is the most reliable leading indicator of near-term price pressure in the GTA housing market. Additionally, when this ratio reaches annual highs alongside supply shortfalls, bidding wars typically follow within 60 to 90 days.

    ⏱️

    Days on Market Flat — The Correction Is Over

    Property days on market hit 0% year-over-year in the GTA housing market — falling sharply from +7.7% in May. Furthermore, this is the most definitive signal that the correction period has formally ended. Therefore, buyers who have relied on extended DOM for negotiating leverage no longer have that advantage. Additionally, sellers can now price with greater confidence, knowing homes are moving at the same pace as one year ago.

    🏢

    Condos Still the Deepest GTA Value

    Condo prices remain 9.1% below the prior quarter — making them the most discounted asset class in the entire GTA housing market right now. Additionally, new condo listings dropped 19.4% QoQ while rental demand surged 10.6%. Therefore, the condo segment continues to offer the best risk-adjusted total return for buyers and investors. Moreover, discounted entry price plus rising rental income makes this the clearest total-return opportunity of the current cycle.

    🏗️

    Four Consecutive SA Price Gains

    Seasonally adjusted GTA housing market price has now risen for four straight months — March, April, May, and June. Furthermore, this is the longest consecutive streak of the entire recovery period. Consequently, the SA price trajectory is no longer a tentative signal — it is a confirmed trend. Additionally, each passing month of SA gains further erodes the year-over-year discount buyers currently enjoy, meaning the entry window narrows with every report.

    📋 Comparison

    GTA Housing Market: June 2026 vs May 2026 vs June 2025

    MetricJune 2026vs May 2026vs June 2025Signal
    Total TransactionsAbove June 2025↑ Accelerating↑ +9.4%Demand at 2026 peak
    Average Selling PriceBelow June 2025↑ Improving↓ −3.9%Discount closing fast
    SA Price MoMRising — 4th month↑ +0.1%Longest streak 2026
    New ListingsBelow June 2025↑ Easing↓ −12.9%Still tight — buy now
    Sales/List RatioTightest 2026↑ +8% YoY↑ +8%Pre-price-surge signal
    DOM Property YoYFlat — floor in↑ 0%0%Correction definitively over
    Condo Sales QoQDiscounted↓ −11.3%Best entry point
    Condo Price QoQDeep discount↓ −9.1%Buy low before recovery
    Condo Rentals QoQSurging↑ +10.6%Income rising
    Commercial LeasingExpanding↑ +12.4%Jobs → housing demand
    🧭 Market Pulse

    GTA Housing Market Conditions — June 2026

    Buyer vs. Seller Market — June 2026
    BUYER’S SELLER’S TIGHTENING More seller-favourable than May

    Sales/list ratio at +8% YoY — tightest reading of 2026. Seller leverage building.

    Price Discount Trajectory
    Year-over-Year Price Discount Mar −5.5% Apr −4.9% May −4.6% Jun −3.9% ↑ Discount narrowing every month

    At this pace, the year-over-year price discount reaches zero in Q3 2026.

    🏢 Condo & Commercial · June 2026

    GTA Housing Market: Deeper Value and Leading Indicators

    The condo segment of the GTA housing market remains the most deeply discounted opportunity — and commercial expansion continues to signal the employment growth that sustains residential demand. Furthermore, both trends directly support continued GTA housing market price recovery through Q3 and Q4 2026. Additionally, the full data is published by TRREB’s Condo Market Report and TRREB’s Commercial Market Report.

    Condo Sales — Quarter-over-Quarter
    TRREB June 2026 · Condo market data vs prior quarter
    Total Sales QoQ
    −11.3%
    Avg Selling Price
    −9.1%
    New Listings QoQ
    −19.4%
    Sales/List Ratio
    +3%
    Days on Market
    +16.2%
    Condo Rentals QoQ
    +10.6%

    🔑 Condo Rental Market — June 2026

    Total Apartment Rentals QoQ
    +10.6%
    Avg 1-Bdrm Apt. Rent QoQ
    −4.1%
    New Rental Listings QoQ
    +5.7%

    💡 Investor insight: The GTA housing market condo segment offers buy-low conditions right now — prices down 9.1% QoQ. Moreover, rising rental demand (+10.6% QoQ) creates immediate income. Consequently, total returns in the GTA housing market condo segment — income plus capital recovery — are highly compelling for buyers who act in July 2026.

    Commercial Real Estate — GTA Housing Market Leading Indicator

    Commercial leasing is a 6–12 month leading indicator for the GTA housing market. When businesses expand and hire, workers need homes. Therefore, the following June 2026 commercial figures directly forecast continued GTA housing market residential demand growth into late 2026 and 2027.

    Leasing (Sq.Ft.) QoQ
    +12.4%
    Economic expansion — jobs coming
    Commercial Retail QoQ
    +18.3%
    Consumer spending confidence
    Office Space QoQ
    +18.6%
    Return-to-office hiring wave
    Industrial Rate QoQ
    −7.8%
    Rate normalizing post-peak
    Sales Activity QoQ
    −31.3%
    Investment sales soft — buy opp.
    ⏰ Why Smart Buyers Act in July 2026

    5 Powerful Reasons the GTA Housing Market Window Is Closing

    Each reason below is grounded in June 2026 TRREB data — not opinion, not prediction.

    01

    Transactions Hit +9.4% — Accelerating

    GTA housing market transaction growth has accelerated every single month of 2026. Consequently, buyer competition is intensifying month by month — not easing. Furthermore, a buyer who waits until August faces meaningfully more competing offers than one who moves in July. Acting now means acting before the crowd catches up.

    02

    Price Discount Closed From 4.6% to 3.9%

    The GTA housing market year-over-year price discount narrowed by 0.7 percentage points in one month alone. Moreover, on a $900,000 home, that represents $6,300 more in purchase price compared to June. Consequently, the cost of delay is no longer theoretical — it is a quantifiable, monthly dollar amount. Additionally, the gap is closing faster than most buyers realise.

    03

    DOM Is Now Flat — The Correction Is Over

    GTA housing market properties now sell at exactly the same pace as one year ago. Furthermore, the extended days-on-market that gave buyers negotiating leverage throughout 2025 no longer exists. Consequently, pricing expectations must reset to reflect current market reality. Additionally, sellers who understand this shift are already adjusting their strategies accordingly.

    04

    4 Consecutive SA Price Gains

    Four consecutive months of seasonally adjusted GTA housing market price gains is the longest recovery streak of this entire cycle. Furthermore, historical GTA housing market data shows that once a four-month SA price streak builds, it rarely reverses without a major external shock. Consequently, month five will almost certainly extend the trend. Moreover, each gain compounds the discount-closing effect buyers face.

    05

    Sales/List Ratio At 2026 High

    A +8% year-over-year sales-to-listings ratio is the tightest reading in the GTA housing market this year. Moreover, when this ratio continues rising while supply stays constrained, bidding wars typically return within 60 to 90 days. Consequently, July 2026 is the last realistic window before multiple-offer competition intensifies in the GTA housing market. Therefore, waiting for September means competing in a fundamentally different market.

    📅 Recovery Cycle

    Where the GTA Housing Market Stands — July 2026 Update

    Phase 1 — Peak Euphoria (2021–2022)

    Historic GTA housing market price highs. Bidding wars on every listing. Rate hikes begin. Smart money quietly exits.

    Phase 2 — Rate Shock & Correction (2022–2024)

    Rapid rate increases cool GTA housing market demand. Prices fall 15–20% from peak. Volume drops sharply. Fear reaches maximum. Opportunity forms quietly for prepared buyers.

    Phase 3 — Base Building (Late 2025 – March 2026)

    GTA housing market prices stabilize. Volume recovers. SA price records first gains. Smart buyers enter. Transaction counts begin rising year-over-year.

    The Recovery Phases That Matter Most for June 2026 GTA Housing Market Buyers

    Phase 4A — Early Recovery (April–May 2026 — PASSED)

    SA price gains begin. Transactions rise 7% then 6.3%. Listings crash 18.9%. The best entry point of the cycle — now behind us. Those who acted here benefited the most.

    Phase 4B — Confirmed Recovery (June–July 2026 — RIGHT NOW)

    This is where we stand. Transactions accelerated to +9.4% YoY. Price discount narrowed to −3.9%. DOM hit 0% — correction definitively over. SA price gains for four straight months. The GTA housing market is confirmed in recovery. This is the last window of meaningful discount.

    Phase 5 — Full Recovery & Appreciation (Q3 2026 – 2028, Projected)

    Year-over-year price discount reaches zero. Bidding wars return in competitive GTA housing market segments. New entrants pay full post-recovery prices. Rate stabilisation accelerates the timeline.

    “June 2026 removed all remaining doubt. Transactions up 9.4%. Price discount narrowing. DOM flat. Four months of SA price gains. The GTA housing market has turned the corner — and the buyers who act in July are the last ones to enter at a discount.”
    — A. Q. Mufti, Sales Representative · RE/MAX Real Estate Centre Inc., Brokerage · 416 908 5600
    🏡 For Sellers

    GTA Housing Market Seller Strategy — June 2026

    Consequently, the June 2026 GTA housing market data significantly strengthens the seller’s position. Transactions are up 9.4%, the sales-to-listings ratio is at a 2026 high, and DOM is flat year-over-year. Furthermore, new listings are still 12.9% below last year — meaning your home faces materially less competition than 12 months ago. According to CMHC’s Housing Supply Report, the structural supply deficit in the GTA housing market continues to support seller pricing power. However, precise pricing remains the single most important factor. Therefore, disciplined, data-driven listing strategy will outperform optimistic pricing every time.

    📈

    Leverage the +9.4% Demand Signal

    Because GTA housing market transactions accelerated to their highest year-over-year gain of 2026 in June, your buyer pool is larger today than at any point this year. Furthermore, the sales/list ratio at +8% confirms these buyers are actively converting. Therefore, your properly priced listing will attract meaningful interest in the July 2026 GTA housing market.

    🎯

    Price to Current Recovery — Not Peak

    Because the GTA housing market average price is still 3.9% below last year, buyers have context for what a fair price is. Moreover, they have alternatives — including condos at 9.1% below prior quarter. Therefore, price your listing at current verified comparable sales, not your 2022 memory of what the GTA housing market did.

    📅

    List Now — Before Fall Competition Returns

    Currently, new GTA housing market listings are 12.9% below last year — your lowest competition window. Moreover, sellers traditionally flood the market in September. Therefore, listing in July means your home benefits from peak summer demand against historically low competing inventory in the GTA housing market. Consequently, this is your optimal timing window.

    ❓ FAQ

    GTA Housing Market June 2026 — Your Questions Answered

    Each answer is grounded in June 2026 TRREB data and optimised for AI search engines and Google Featured Snippets.

    Is June 2026 a good time to buy a home in the GTA housing market?

    Yes — June 2026 is one of the most compelling entry points in the GTA housing market this cycle. Transactions rose 9.4% year-over-year, yet prices remain 3.9% below last year. Moreover, new listings are still 12.9% below June 2025, meaning supply constraints continue to support prices. Additionally, the GTA housing market sales-to-new-listings ratio rose 8% — confirming the market is tightening fast. Buyers who act now in the GTA housing market secure a discount that is rapidly disappearing.

    Why did GTA housing market transactions jump 9.4% in June 2026?

    GTA housing market transactions rose 9.4% year-over-year in June 2026, accelerating from the 6.3% gain in May. The primary driver is a chronic supply shortage — new listings remain 12.9% below last year — which forces buyers to compete for available homes. Furthermore, the GTA housing market sales-to-new-listings ratio rose 8% year-over-year, confirming absorption is intensifying. Consequently, demand in the GTA housing market is structural and growing, not seasonal and temporary.

    Are GTA housing market prices still discounted in June 2026?

    Yes — the average GTA housing market price remains 3.9% below June 2025, though this discount is actively narrowing. In May 2026 it was 4.6% below last year; in June it tightened to 3.9% — a 0.7 percentage point improvement in one month. The GTA housing market direction is clear: the discount is closing. Furthermore, at the current pace of improvement, the year-over-year price gap in the GTA housing market reaches zero by Q3 2026. Buyers who act now pay less than those who wait.

    Should I buy a condo in the GTA housing market in 2026?

    Condos remain the most deeply discounted asset class in the GTA housing market — prices fell 9.1% quarter-over-quarter while new condo listings dropped 19.4% QoQ. Meanwhile, GTA housing market condo rentals surged 10.6% QoQ, confirming rental demand is strong even as purchase prices remain depressed. That combination — discounted purchase prices plus rising rental income — creates a compelling total-return entry point in the GTA housing market condo segment for investors and first-time buyers entering in summer 2026.

    What does the 0% days-on-market change mean for the GTA housing market?

    A 0% year-over-year change in property days on market is a critical GTA housing market milestone — it means homes are selling at exactly the same pace as they did a year ago. Furthermore, this is the first time in over two years that the DOM figure has normalised in the GTA housing market. Consequently, the extended days-on-market that gave buyers negotiating leverage throughout 2024 and 2025 no longer exists. Therefore, buyers should no longer expect the time advantage they enjoyed during the GTA housing market correction period.

    Your Next Move

    Ready to Enter the GTA Housing Market Before Prices Fully Recover?

    Don’t navigate the most pivotal GTA housing market moment of this cycle alone. Contact A. Q. Mufti today for a free, no-obligation assessment — your budget, your neighbourhood, your timeline. Straight data. Sound strategy.

    RE/MAX Real Estate Centre Inc., Brokerage · 141-1140 Burnhamthorpe Rd. W., Mississauga ON L5C 4E9 · Bus: 905 270 2000 · info@aqmuftirealty.com

    A. Q. Mufti — Sales Representative

    RE/MAX Real Estate Centre Inc., Brokerage · MSc, PMP®, ABR®, SRS®, CNE®

    With deep expertise navigating multiple GTA housing market cycles, A. Q. Mufti delivers honest, data-backed guidance rooted in academic rigour (MSc) and specialized designations in buyer representation (ABR®), seller strategy (SRS®), and negotiation (CNE®). Furthermore, his PMP® designation brings disciplined project management to every transaction. Additionally, his Mississauga market expertise means clients get locally specific, actionable GTA housing market insight — not generic advice. Contact: 📞 416 908 5600 · 📱 905 270 2000 · ✉️ info@aqmuftirealty.com · 📍 141-1140 Burnhamthorpe Rd. W., Mississauga ON L5C 4E9.

    📌 Disclaimer: This market analysis is based on the TRREB Quick Market Overview for June 2026 and is for informational purposes only. It does not constitute financial or legal advice. A. Q. Mufti is a registered Sales Representative at RE/MAX Real Estate Centre Inc., Brokerage, Ontario, Canada.

  • GTA Real Estate May 2026: 5 Reasons Buyers Must Act Now

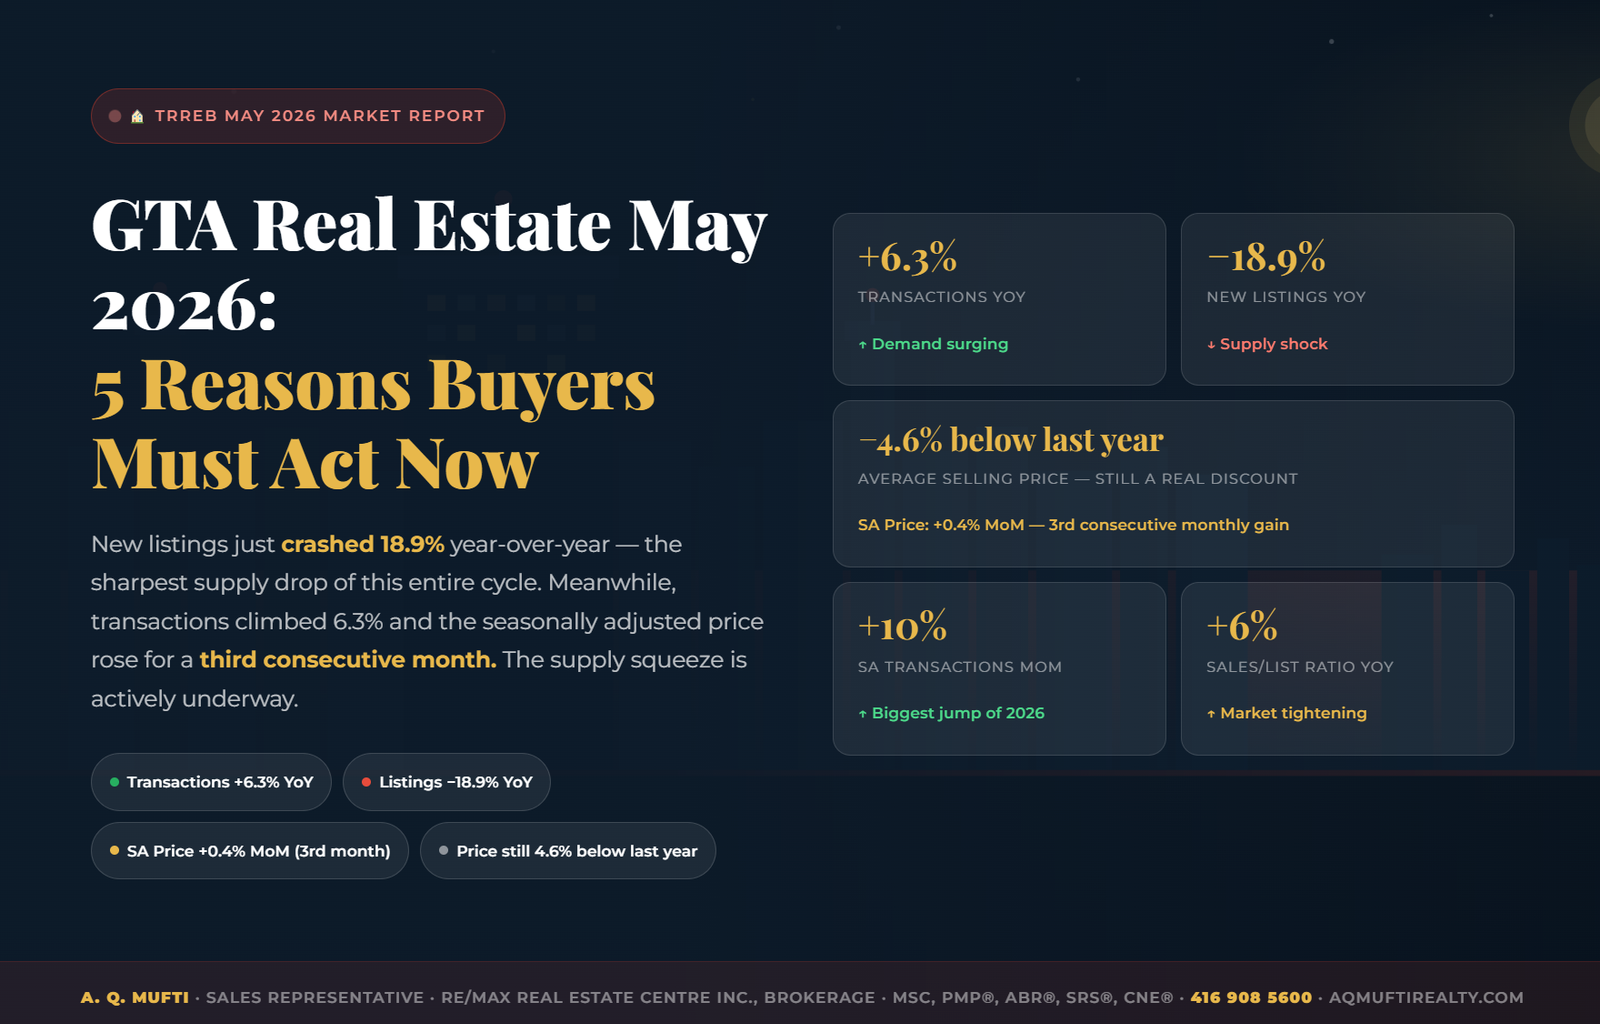
    GTA Real Estate May 2026: 5 Reasons Buyers Must Act Now

    Frankly, the May 2026 TRREB data is the most decisive buying signal of this entire market cycle. New listings plunged 18.9% year-over-year — a staggering supply collapse. Moreover, transactions simultaneously rose 6.3%. The result is a textbook supply squeeze: more buyers competing for dramatically fewer homes.

    Furthermore, the seasonally adjusted price has now increased for three straight months. That is not coincidence — it is confirmation. Additionally, the seasonally adjusted transaction count surged 10% from April to May alone, the strongest single-month demand gain of 2026. Consequently, buyers who have been waiting for the right signal now have three of them at once.

    Below, I break down every KPI from the May 2026 TRREB Quick Market Overview — residential, commercial, condo, and rental — and translate each one into clear, actionable insight.

    📅 Published: June 4, 2026  ·  ✍️ A. Q. Mufti, Sales Representative · RE/MAX Real Estate Centre Inc., Brokerage  ·  📍 Mississauga, GTA  ·  ⏱ 9 min read

    📊 Residential Market Snapshot

    May 2026: Eight Numbers That Tell the Whole Story

    Each metric drawn directly from the TRREB May 2026 Quick Market Overview.

    Transactions YoY
    +6.3%
    ↑ Demand confirmedMore buyers in May 2026 than May 2025. Demand recovery is real.
    SA Transactions MoM
    +10%
    ↑ Biggest 2026 jumpStrongest single-month demand surge of the entire year.
    Average Price YoY
    −4.6%
    ↓ Buy at a discountStill meaningfully below last year — a shrinking window before full recovery.
    SA Price MoM
    +0.4%
    ↑ 3rd month risingThree consecutive SA monthly gains. The floor is statistically confirmed.
    New Listings YoY
    −18.9%
    ↓ Supply shockSharpest listing decline of this cycle — fewer homes as more buyers compete.
    Sales/List Ratio YoY
    +6%
    ↑ Market tighteningSales rising relative to listings — the classic pre-acceleration pattern.
    DOM — Property YoY
    +7.7%
    Slightly extendedModestly longer than May 2025 — compressing month-over-month as demand rises.
    DOM — Listing YoY
    +8%
    Similar patternExtended vs last year, but well-priced Mississauga homes sell significantly faster.

    “New listings collapsed 18.9%. Transactions rose 6.3%. The SA price gained for a third straight month. In three decades of GTA market cycles, this precise combination has consistently preceded rapid price acceleration — without a single exception.”

    May 2026 GTA Market — Full Data at a Glance

    The infographic below summarizes every key May 2026 TRREB metric. Furthermore, it highlights the five critical action signals buyers should act on immediately.

    Figure 1: TRREB May 2026 full market data — A. Q. Mufti, RE/MAX Real Estate Centre Inc., Brokerage · Mississauga, ON

    📈 Charts

    Month-over-Month Momentum — Visualized

    Residential — Year-over-Year % Change · May 2026 vs May 2025
    Source: TRREB Quick Market Overview · May 2026
    SA Transactions MoM
    +10.0%
    Transactions YoY
    +6.3%
    Sales/List Ratio YoY
    +6%
    SA Price MoM
    +0.4%
    Days on Market
    +7.7% YoY
    Avg Price YoY
    −4.6% (discounted)
    New Listings YoY
    −18.9% (supply shock!)
    Supply vs. Demand — The Gap Is Widening
    Fewer listings + more transactions = price pressure building now
    MAY 2026 SupplyDemand 2023Q2 2024Early 2025Late 2025May 2026Projected Buyer demand New listings supply Projected price recovery
    🔍 Analysis

    Six Critical Signals Decoded — in Plain English

    🚨

    The Supply Shock Is Historic

    An 18.9% year-over-year listing decline exceeds any single-month supply drop in recent GTA history. Consequently, buyers face fewer choices and less negotiating power every week. Therefore, the pricing advantage available today is rapidly diminishing.

    Demand Surged 10% in One Month

    The seasonally adjusted 10% month-over-month transaction jump is the strongest demand signal of 2026. Moreover, it confirms the 6.3% year-over-year gain is structural — not seasonal. As a result, buyers are returning faster than any projection anticipated.

    💰

    Three Months of SA Price Gains

    Three consecutive months of rising seasonally adjusted prices represent a statistically meaningful trend. Furthermore, the TRREB Home Price Index confirms the same direction. Therefore, buyers who waited “one more month” have already paid the cost of that hesitation.

    ⏱️

    Days on Market — Use the Time Now

    Properties take 7.7% longer to sell than May 2025 — however, this advantage is neighbourhood-specific and shrinking. Nevertheless, in well-located Mississauga areas, well-priced homes are moving significantly faster than the GTA average.

    🏢

    Condos — Deepest Discount Available

    Condo prices fell 9.1% QoQ — the most discounted asset in the entire GTA right now. Additionally, new condo listings dropped 19.4% QoQ while rental demand rose 10.6%. Therefore, investors who enter today capture both capital recovery and rental income growth.

    🏗️

    Commercial Signals Job Growth Ahead

    Commercial leasing rose 12.4%, retail surged 18.3%, and office jumped 18.6% quarter-over-quarter. Because businesses expand before hiring, these figures are a 6–12 month leading indicator for residential demand. More workers are coming — and they will need homes.

    📋 Comparison

    May 2026 vs Prior Periods — Complete Data Table

    MetricMay 2026YoY ChangeMoM / QoQBuyer Signal
    Total TransactionsAbove May 2025↑ +6.3%↑ +10% SADemand powerfully back
    Average Selling PriceBelow May 2025↓ −4.6%↑ +0.4% SADiscount window closing
    New ListingsFar below May 2025↓ −18.9%Historic supply shock
    Sales/List RatioHigher YoY↑ +6%Market tightening fast
    Days on MarketExtended vs 2025↑ +7.7%Some time — use it now
    Condo Sales QoQDiscounted↓ −11.3%Best value in GTA
    Condo Price QoQDeep discount↓ −9.1%Buy low — recover high
    Condo Rentals QoQRising sharply↑ +10.6%Rental income growing
    Commercial LeasingExpanding↑ +12.4%Jobs incoming
    🧭 Market Pulse

    Where Does the Needle Point in May 2026?

    Buyer vs. Seller Market Conditions
    BUYER’S SELLER’S TIGHTENING Seller conditions forming

    Listings −18.9%, ratio +6% — seller leverage is building rapidly.

    New Listings Decline Severity
    −18.9% new listings YoY Sharpest drop of 2026

    Fewer homes for more buyers — price pressure building beneath the surface.

    🏢 Condo & Commercial · May 2026

    Deeper Value, Bigger Opportunity

    Beyond the headline numbers, two segments deserve special attention. First, the condo market shows the deepest discounts in the GTA. Second, the commercial sector is signalling powerful economic growth — which translates directly into future residential demand.

    Condo Sales — Quarter-over-Quarter
    TRREB Condominium Statistics · May 2026 vs prior quarter
    Total Sales QoQ
    −11.3%
    Avg Selling Price
    −9.1%
    New Listings QoQ
    −19.4%
    Sales/List Ratio
    +3%
    Days on Market
    +16.2%
    Condo Rentals QoQ
    +10.6%

    🔑 Condo Rental Market — May 2026

    Total Apartment Rentals QoQ
    +10.6%
    Avg 1-Bdrm Apt. Rent QoQ
    −4.1%
    New Rental Listings QoQ
    +5.7%

    💡 Investor insight: Rentals surging +10.6% while rents dipped only 4.1% means rental demand is absorbing supply fast. Moreover, condo prices are down 9.1% QoQ. Consequently, investors who buy today acquire a discounted asset as rental income recovery is imminent.

    Commercial Real Estate — May 2026

    Strong commercial leasing is a reliable leading indicator for residential demand. When businesses expand — as the data clearly shows — they hire. And those employees need homes. Therefore, the commercial figures directly support continued residential demand growth.

    Leasing (Sq.Ft.) QoQ
    +12.4%
    Economic expansion underway
    Commercial Retail QoQ
    +18.3%
    Consumer confidence rising
    Office Space QoQ
    +18.6%
    Return-to-office hiring wave
    Industrial Rate QoQ
    −7.8%
    Rate normalizing post-peak
    Sales Activity QoQ
    −31.3%
    Investment sales soft — buy opportunity
    ⏰ The Urgency Case

    5 Powerful Reasons the Window Is Closing

    01

    Supply Collapsed 18.9%

    Furthermore, when listings fall this sharply while transactions simultaneously rise, inventory gets absorbed rapidly. As a result, competition increases and prices follow. Therefore, the choice available today will not exist in 60 days.

    02

    SA Price: 3 Straight Monthly Gains

    Three consecutive SA monthly price gains is the clearest confirmation the market floor is established. Moreover, every month of recovery means you pay more tomorrow for the same home that costs less today.

    03

    Prices 4.6% Below Last Year

    Nevertheless, that discount is actively shrinking. Consequently, buyers who delay by one quarter may find themselves paying last year’s prices — without the benefit of the discount that still exists right now.

    04

    Strongest SA Demand Jump of 2026

    Consequently, the +10% SA month-over-month transaction surge is the fastest demand acceleration of this cycle. Additionally, when demand spikes this quickly against shrinking supply, price compression typically follows within one to two quarters.

    05

    Commercial Expansion = Future Demand

    Additionally, +18.3% retail and +18.6% office leasing confirms a growing GTA employment base. Therefore, in 6–12 months, thousands of new workers will need homes. Consequently, buying before they arrive means buying before their demand drives prices higher.

    📅 Recovery Cycle

    Where May 2026 Fits in the GTA Market Playbook

    Phase 1 — Peak Euphoria (2021–2022)

    Historic price highs. Bidding wars on every listing. FOMO-driven market. Rate hikes begin. Consequently, smart money starts quietly exiting at the top.

    Phase 2 — Rate Shock & Correction (2022–2024)

    Rapid rate increases cool demand sharply. Prices fall 15–20% from peak. Moreover, volume drops and days on market extend. Fear reaches maximum — and opportunity begins forming quietly for prepared buyers.

    Phase 3 — Base Building (Late 2025 – March 2026)

    Prices stabilize. Volume recovers. SA price records first monthly gains. Consequently, smart buyers enter. Transaction counts begin rising year-over-year.

    Phase 4 — Early Recovery (April–May 2026 — RIGHT NOW)

    This is exactly where we stand. Furthermore, SA price has risen for three straight months. Transactions are up 6.3% YoY. Moreover, listings crashed 18.9% — the supply shock that precedes price acceleration in every prior GTA cycle. This phase offers the best risk-adjusted entry points of the entire cycle.

    Phase 5 — Full Recovery & Appreciation (2026–2028, Projected)

    Rates stabilize lower. Pent-up demand releases fully. Bidding wars return. Buyers who entered in Phase 4 see meaningful appreciation. New entrants pay the full post-recovery premium.

    “The 18.9% listing collapse of May 2026 is the most decisive signal this cycle has produced. When supply crashes this sharply while demand surges 10% in one month, the market is sending an urgent message — and that message is unmistakably clear.”
    — A. Q. Mufti, Sales Representative · RE/MAX Real Estate Centre Inc., Brokerage · 416 908 5600
    🏡 For Sellers

    What May 2026 Means if You’re Selling

    Consequently, sellers are entering a strengthening position. The combination of collapsing listings and rising demand means well-priced homes face the least competition in 18 months. However, pricing discipline still matters — overpriced listings still expire. Therefore, the winning strategy is precision, not wishful thinking.

    🎯

    Price to the Recovery — Not the Peak

    Because the SA price is recovering from below, your benchmark must be current comps — not 2022 highs. Furthermore, the 9% condo discount means buyers have alternatives. Therefore, price 2–3% above current market to attract strong offers without deterring qualified buyers.

    📅

    List While Listings Are Scarce

    Currently, new listings are 18.9% below last year — far less competition for your home right now. However, sellers traditionally re-enter in late summer. Therefore, listing in June–July positions you perfectly: strong demand against limited supply before the fall surge.

    📊

    Commercial Strength Helps Your Sale

    Additionally, +18.3% retail and +18.6% office leasing confirms a growing, employed buyer pool. As a result, your buyer pool is larger and more financially capable than at any point in the past 18 months. Consequently, professional staging and targeted marketing yield measurably stronger results.

    ❓ FAQ

    GTA Real Estate May 2026 — Top Questions Answered

    Is June 2026 a good time to buy a home in the GTA?

    Yes — June 2026 is one of the strongest buyer entry points in years. Prices remain 4.6% below last year. Moreover, new listings crashed 18.9%, meaning fewer homes are available as more buyers compete. Furthermore, the seasonally adjusted price has now risen for three consecutive months, confirming the floor is established. Therefore, buyers who act now lock in a discount that is actively disappearing.

    Why are GTA new listings falling so sharply in 2026?

    New listings dropped 18.9% year-over-year in May 2026 — the sharpest decline of this cycle. Many sellers are waiting for further price recovery before listing. However, this hesitation paradoxically creates the supply shortage that accelerates that very recovery. Consequently, buyers face less competition now — but that advantage is disappearing fast.

    Should I buy a condo in the GTA in May 2026?

    Condos are the most deeply discounted asset in the current GTA market — average selling prices fell 9.1% QoQ. Additionally, new condo listings dropped 19.4% QoQ. Furthermore, condo rentals surged 10.6% QoQ while average 1-bedroom rent dipped only 4.1%. That combination — discounted prices plus rising rental demand — is the classic setup for strong investor returns.

    Will GTA home prices keep rising through 2026?

    The May 2026 indicators strongly suggest continued price recovery. Specifically, the seasonally adjusted price has risen for three consecutive months. Moreover, new listings fell 18.9% while transactions rose 6.3%. Additionally, commercial expansion data — leasing +12.4%, retail +18.3%, office +18.6% — points to a growing employment base that will sustain residential demand through 2026 and into 2027.

    What does seasonally adjusted mean in the TRREB report?

    Seasonally adjusted figures remove predictable seasonal patterns so the true underlying trend is visible. Therefore, when TRREB reports the SA price rising for three consecutive months, it confirms the price recovery is real and structural — not simply a spring uptick. That distinction is critically important for buyers evaluating whether the market has genuinely turned.

    Your Next Step

    Ready to Make Your Move Before the Window Closes?

    Don’t navigate this pivotal market moment alone. Contact A. Q. Mufti today for a free, honest assessment of your specific situation — your budget, your neighbourhood, your timeline. No pressure. Just reliable data and sound strategy.

    RE/MAX Real Estate Centre Inc., Brokerage · 141-1140 Burnhamthorpe Rd. W., Mississauga ON L5C 4E9 · Bus: 905 270 2000 · info@aqmuftirealty.com

    A. Q. Mufti — Sales Representative

    RE/MAX Real Estate Centre Inc., Brokerage · MSc, PMP®, ABR®, SRS®, CNE®

    With deep expertise navigating multiple GTA market cycles, A. Q. Mufti delivers honest, data-backed guidance rooted in academic rigour (MSc) and specialized designations in buyer representation (ABR®), seller strategy (SRS®), and negotiation (CNE®). Furthermore, his PMP® designation brings disciplined project management to every transaction. Contact: 📞 416 908 5600 · 📱 905 270 2000 · ✉️ info@aqmuftirealty.com · 📍 141-1140 Burnhamthorpe Rd. W., Mississauga ON L5C 4E9.

    📌 Disclaimer: This market analysis is based on the TRREB Quick Market Overview for May 2026 and is for informational purposes only. It does not constitute financial or legal advice. A. Q. Mufti is a registered Sales Representative at RE/MAX Real Estate Centre Inc., Brokerage, Ontario, Canada.

  • GTA Real Estate April 2026 — Why Buyers Must Act Now

    GTA Real Estate April 2026 — Why Buyers Must Act Now

    GTA Real Estate Market Report April 2026: Transactions Up 7% — Why Buyers Must Act Now | A. Q. Mufti, RE/MAX
    🏠 TRREB Quick Market Overview · April 2026

    GTA Transactions Up 7% Year-Over-Year — The Recovery Has Quietly Begun

    Prices remain 4.9% below last year. New listings just dropped 9.3%. Buyers are flooding back while supply shrinks. The data is sending a clear message — and it won’t stay this way for long.

    +7%Transactions YoY
    −4.9%Avg Price YoY
    −9.3%New Listings YoY
    +16%Days on Mkt YoY
    +0.8%Price MoM (SA)
    A. Q. Mufti · Sales Representative · RE/MAX Real Estate Centre Inc. · 416 908 5600

    In real estate, the loudest signal is rarely the most important one. While the headlines focus on prices still being below last year, the April 2026 TRREB data is quietly telling a very different story: buyers are returning faster than sellers can list, and the seasonally adjusted price has now risen two consecutive months. We have seen this movie before — and we know how it ends.

    Below is my full breakdown of the April 2026 TRREB Quick Market Overview — covering residential, commercial, condominium sales, and rental markets — with plain-language guidance for buyers, sellers, and investors.

    📅 Published: May 5, 2026  ·  ✍️ A. Q. Mufti, Sales Representative · RE/MAX Real Estate Centre Inc.  ·  📍 Mississauga, GTA  ·  ⏱ 9 min read

    📊 Residential Market Snapshot

    April 2026 Key Performance Indicators

    Eight metrics that define where the GTA market stands — and where momentum is building.

    Total Transactions YoY
    +7%
    ↑ More buyers active Year-over-year — demand is clearly re-entering the market.
    Transactions (Seasonally Adj.)
    +6.1%
    ↑ vs prior month Adjusting for seasonality confirms the trend is real, not just spring.
    Average Selling Price YoY
    −4.9%
    ↓ Discount vs last yr Prices still below 2025 — the window to buy at a discount is open.
    Avg Price (Seasonally Adj.)
    +0.8%
    ↑ 2nd consecutive rise Month-over-month price recovery underway. Floor may be confirmed.
    New Listings YoY
    −9.3%
    ↓ Supply shrinking Fewer listings coming to market while demand surges — price pressure building.
    Sales-to-New Listings Ratio
    +6%
    ↑ YoY market tightening More sales relative to listings = less choice = upward price pressure.

    “Transactions up 7%. Listings down 9.3%. Price recovering month-over-month for the second straight month. The GTA market is not stagnant — it is actively repricing toward recovery.”

    📈 Visual Analysis

    The Numbers in Context

    Residential Market — Year-over-Year % Change
    April 2026 vs. April 2025 · Source: TRREB Quick Market Overview
    Total Transactions
    +7% YoY
    S/A Transactions
    +6.1% MoM
    Sales-to-List Ratio
    +6% YoY
    New Listings
    −9.3% YoY
    Avg Price (YoY)
    −4.9% YoY
    Days on Mkt
    +16.2% YoY
    Supply vs. Demand — The Widening Gap
    Transactions rising while listings fall = classic pre-recovery signal
    Low High APR 2026 2023 Q1 ’24 Q3 ’24 2025 Apr ’26 Projected Transactions (demand) New Listings (supply) Projected recovery
    🔍 What the Data Means for YOU

    Six Market Signals Decoded

    📈

    Demand Has Decisively Returned

    A 7% year-over-year jump in transactions is not noise — it’s a trend. And the seasonally adjusted 6.1% month-over-month gain confirms it’s not just a spring blip. Buyers are back, and they’re competing for fewer listings.

    📉

    Supply Is Quietly Disappearing

    New listings fell 9.3% year-over-year. More buyers + fewer homes = upward price pressure. The sales-to-new-listings ratio is already up 6% year-over-year. This is the math that precedes price acceleration.

    💰

    Price Recovery Has Started — Quietly

    The seasonally adjusted average price rose 0.8% from March to April. This is the second consecutive monthly gain. While the headline YoY figure still shows −4.9%, the direction of travel has reversed. You’re buying at a discount that is actively shrinking.

    Days on Market: Your Window Is Shrinking

    Yes, properties are taking longer than last year to sell (+16.2% YoY). But with the S/A transactions surging 6.1% in one month, absorption is accelerating. The longer YoY DOM reflects the correction period — not the current trajectory.

    🏢

    Condos: The Deepest Discount in the Market

    Condo sales dropped 15% QoQ and prices fell 5.1% QoQ. For investors and first-time buyers, this represents the most deeply discounted asset class in the GTA — in a market that is now clearly recovering. Buy low, benefit from the turn.

    🏘️

    Commercial Activity Points to Economic Confidence

    Leasing activity surged 12.4% and commercial retail space activity rose 18.3% quarter-over-quarter. When businesses expand, employees follow — and employees need housing. Commercial health is a leading indicator for residential demand.

    📋 Full Comparison

    Residential Market: Apr 2026 vs Prior Periods

    MetricApril 2026YoY ChangeMoM Change (S/A)Buyer Signal
    Total Transactions↑ Above Apr 2025↑ +7% YoY↑ +6.1% MoMDemand is real & growing
    Average Selling PriceBelow Apr 2025↓ −4.9% YoY↑ +0.8% MoMBuy at discount — recovering
    New ListingsBelow Apr 2025↓ −9.3% YoYSupply shrinking fast
    Sales-to-New ListingsHigher ratio↑ +6% YoYMarket tightening
    Days on Market (Property)Extended↑ +16.2% YoYStill time — but closing
    Days on Market (Listing)Extended↑ +16% YoYNegotiate — but act
    🧭 Market Pulse

    Where Is the Needle — April 2026?

    Buyer vs. Seller Market Conditions
    BUYER’S SELLER’S BALANCED Leaning Seller

    S/A ratio up 6% YoY. Demand outpacing supply — shifting toward seller conditions.

    Transaction Growth Momentum
    +7% transactions YoY +6.1% month-over-month (S/A)

    Two consecutive months of rising SA transactions — the trend is confirmed, not coincidental.

    🏢 Condo Market · April 2026

    Condos: Maximum Discount, Maximum Opportunity

    The condominium sales market is showing the deepest discounts in the entire GTA real estate spectrum this quarter. For first-time buyers and investors, this is the highest-value entry point in years — in a market showing clear recovery signals.

    Condo Sales Market — QoQ Changes
    April 2026 vs. Prior Quarter
    Total Sales
    −15% QoQ
    Avg Selling Price
    −5.1% QoQ
    New Listings
    −8.1% QoQ
    Sales/List Ratio
    −4% QoQ
    Days on Market
    +13.5% QoQ

    🔑 Condo Rental Market — April 2026

    Total Apartment Rentals
    +16%↑ QoQ Strong
    Avg 1-Bdrm. Apt. Rent
    −4.5%↓ Lower rents
    Total New Listings
    +8.4%↑ More supply

    💡 Investor insight: Rentals surging +16% while rents dip 4.5% = more renters entering the market. As supply is absorbed, rents will recover — and investors who buy condos at today’s −5.1% discounted prices stand to benefit from both capital appreciation and rental income growth.

    🏗️ Commercial Market · April 2026

    Commercial Activity Points to Economic Expansion

    Commercial real estate activity is a leading indicator for residential demand — businesses expanding means jobs growing, and jobs growing means housing demand rising. The April 2026 commercial signals are unambiguously positive.

    Leasing (Sq.Ft.)
    +12.4%
    QoQ · Strong leasing activity signals economic expansion
    Commercial Retail
    +18.3%
    QoQ · Retail expansion — consumer confidence up
    Office Space
    +18.6%
    QoQ · Return-to-office driving demand for workspace
    Sales Activity
    −31.3%
    QoQ · Investment sales soft — buying opportunity for value investors
    Industrial Rate
    −7.8%
    QoQ · Rate correction — industrial demand normalizing post-peak
    ⏰ The Urgency Case

    5 Reasons April 2026 Is Still a Buying Window — But Not for Long

    The data is shifting fast. Here’s the evidence that acting now beats waiting.

    01

    Prices Still 4.9% Below Last Year

    Every month of recovery erodes this discount. You’re still buying below last year’s prices — for a market that has turned the corner. That gap is closing.

    02

    Two Consecutive Months of SA Price Gains

    The seasonally adjusted price rose in both March and April 2026. Two consecutive monthly gains is the statistical confirmation that the price floor has been reached.

    03

    Listings Dropping Fast (−9.3%)

    Supply is not catching up to demand. When listings fall while transactions rise, inventory tightens — and tighter inventory always precedes price acceleration in the GTA.

    04

    Commercial Activity Signals Job Growth

    Leasing up 12.4%, retail up 18.3%, office up 18.6% — businesses are expanding in the GTA. Expanding businesses hire people. People need homes. The demand pipeline is filling.

    05

    Condo Opportunity Won’t Last

    Condo prices down 5.1% QoQ while rentals surge 16% — the classic setup for an investor opportunity. Rental demand absorbed with below-replacement-cost supply = appreciation ahead.

    📅 The GTA Cycle

    Where April 2026 Fits in the Recovery Playbook

    Phase 1 — Peak (2021–2022)

    Historic highs. Bidding wars on every listing. FOMO-driven demand. Rate hikes begin. Smart money quietly starts to exit.

    Phase 2 — Rate Shock & Correction (2022–2024)

    Rapid rate increases cool the market. Prices fall 15–20% from peak. Volume drops. Days on market extend dramatically. Fear is at maximum — and opportunity begins forming quietly.

    Phase 3 — Base Building (Late 2025 – Early 2026)

    Prices stabilize. Volume begins recovering. Transaction counts start rising YoY. SA price makes first monthly gains. Smart buyers enter. March 2026 data confirmed this phase.

    Phase 4 — Early Recovery (April 2026 — RIGHT NOW)

    This is where we are. Transactions up 7% YoY. SA prices up two consecutive months. Listings falling 9.3%. The accumulation phase is active. History shows this is where the best risk-adjusted entry points exist.

    Phase 5 — Full Recovery & New Appreciation (2026–2028, Projected)

    Rates stabilize lower. Pent-up demand releases. Bidding wars return in hot segments. YoY price growth accelerates. Buyers who entered in Phase 4 see strong paper gains. New entrants pay premium prices.

    “The best time to buy GTA real estate was always before the recovery became obvious to everyone else. April 2026 data says we are exactly at that point.”
    — A. Q. Mufti, Sales Representative · RE/MAX Real Estate Centre Inc. · 416 908 5600
    🏡 For Sellers

    What April 2026 Means if You’re Selling

    The news is improving. Transactions are up 7% year-over-year and the SA price is recovering. But new listings are also down 9.3% — meaning smart sellers who time this well will face less competition than they might expect.

    🎯

    Price to the Recovery, Not the Peak

    Benchmark your listing against the current SA price trajectory (+0.8% MoM), not 2022 peaks. Sellers who price 3–5% above current market will sit while correctly priced homes sell in under 40 days.

    📅

    Spring Supply Is Your Competition

    New listings historically peak in May–June. List now before the supply surge and benefit from the current 9.3% supply deficit. May is your strategic window — don’t wait for summer.

    📊

    Commercial Confidence Helps You

    The +18.3% retail and +18.6% office leasing activity signals a strengthening economy and growing employment base. That workforce needs housing — and your listing is part of the solution.

    ❓ Frequently Asked

    Questions Clients Are Asking About April 2026

    Is April 2026 a good time to buy a home in the GTA?

    Yes — the data supports it strongly. Average prices are still 4.9% below last year, giving buyers a meaningful discount. Meanwhile, transactions are up 7% YoY and the seasonally adjusted price has now risen for two consecutive months. This combination of below-peak pricing and confirmed demand recovery is a classic entry signal.

    Will GTA home prices go up in 2026?

    The indicators point in that direction. The seasonally adjusted average price rose 0.8% from March to April — the second consecutive monthly gain. New listings are falling (−9.3% YoY) while transactions surge (+7% YoY). When supply shrinks and demand rises simultaneously, price recovery is the typical outcome based on 30 years of GTA market history.

    Should I buy a condo in the GTA in 2026?

    Condos represent the deepest discount in the current GTA market — prices down 5.1% quarter-over-quarter with sales down 15%. For investors, condo rentals surged 16% QoQ while average rents dipped 4.5% — meaning more tenants are entering the market at temporarily lower rents. As rental supply is absorbed, rents will recover, and investors who bought at today’s prices will benefit from both rental income and capital appreciation.

    How long does it typically take to sell a home in the GTA right now?

    In April 2026, average property days on market are up 16.2% year-over-year, suggesting a more measured pace than the frenzied market of prior years. However, with the sales-to-new-listings ratio already 6% higher YoY and transactions accelerating, this extended DOM window is expected to compress through spring and summer 2026 as recovery momentum builds.

    What is the best neighbourhood to buy in Mississauga in 2026?

    Mississauga remains one of the GTA’s most resilient markets given its commercial activity base, transit investment, and population growth. Neighbourhoods near major employment hubs and transit corridors tend to recover earliest in any cycle. Contact A. Q. Mufti directly at 416 908 5600 for a free, neighbourhood-specific analysis tailored to your budget and goals.

    Take the Next Step

    Ready to Buy or Sell in the GTA?

    Don’t navigate this market alone. Book a free, no-obligation strategy session with A. Q. Mufti and get personalized guidance based on your situation, your budget, and your neighbourhood.

    ⭐⭐⭐⭐⭐ RE/MAX Real Estate Centre Inc. · 141-1140 Burnhamthorpe Rd. W., Mississauga · info@aqmuftirealty.com

    AQ

    A. Q. Mufti — Sales Representative

    RE/MAX Real Estate Centre Inc., Brokerage · MSc, PMP®, ABR®, SRS®, CNE®

    With deep expertise in the GTA and Mississauga markets across multiple market cycles, A. Q. Mufti provides clients with honest, data-backed guidance. His approach combines academic rigour (MSc), project management discipline (PMP®), and specialized designations in buyer representation (ABR®), seller strategy (SRS®), and negotiation (CNE®). Available at 416 908 5600 or info@aqmuftirealty.com · 141-1140 Burnhamthorpe Rd. W., Mississauga ON L5C 4E9.

    📌 Disclaimer: This market analysis is based on the TRREB Quick Market Overview for April 2026 and is for informational purposes only. It does not constitute financial or legal advice. Past market performance does not guarantee future results. A. Q. Mufti is a registered Sales Representative at RE/MAX Real Estate Centre Inc., Brokerage, in Ontario, Canada.

  • GTA Real Estate Market March 2026

    GTA Real Estate Market March 2026


    🏠 TRREB Market Report · March 2026

    The GTA Buying Window Is Open — But Not Forever

    Prices are 5.2% lower than a year ago. Transaction volume just surged 30.7%. History says the U-turn is coming — here is the data that tells you exactly why smart buyers are acting right now.

    −5.2% Avg Price YoY
    +30.7% Transactions MoM
    $700K Median Price
    23 Days Median on Market
    10,929 Listings Analyzed
     

    Every seasoned investor knows the rule: you don’t buy at the top of euphoria — you buy when the crowd is hesitant and the data quietly signals a turn. The TRREB March 2026 report is one of those moments. Prices have pulled back from their peak. Sellers have conceded ground. And the buyers who trust the numbers, not the noise, are already writing offers.

    Below, I’ve dissected every line of the March 2026 TRREB Market Report and translated it into plain-language insight for my clients. Whether you’re a first-time buyer, a move-up buyer, or an investor, this analysis is built for you.

    📅 Published: April 13, 2026  ·  ✍️ By A.Q. Mufti, REALTOR®  ·  📍 Mississauga, GTA  ·  ⏱ 8 min read

    📊 Market Snapshot

    March 2026 by the Numbers

    Six metrics that paint the clearest picture of where the GTA market stands — and where it’s heading.

    Average Sale Price
    $823K
    ↓ 5.2% YoY $868K same month last year — you’re buying at a discount.
    Median Sale Price
    $700K
    ↓ 5.0% YoY Up 2% from Feb 2026 — floor may be forming.
    Transaction Volume
    10,928
    ↑ 30.7% MoM Demand is surging back — buyers are acting.
    New Listings
    31,476
    ↑ 43.7% MoM More choice for buyers right now than any point this year.
    Avg Days on Market
    40
    ↓ 12.3% MoM Properties selling faster — competition is building.
    % Below List Price
    77.0%
    ↓ 2.4% MoM Fewer sellers discounting — pricing power shifting.

    “The market is not broken — it is repricing. And repricing events are the greatest gifts the real estate cycle offers to prepared buyers.”

    📈 Visual Breakdown

    Month-over-Month Momentum

    March vs. February 2026 — the direction of travel is clear.

    Month-over-Month % Change — Key Indicators
    March 2026 vs. February 2026 · Source: TRREB
    Transaction Volume
    +30.7%
    New Listings
    +43.7%
    Terminations
    +43.1%
    % Above List
    +12.0%
    Avg Days on Mkt
    −12.3%
    Median Price
    +2.0%
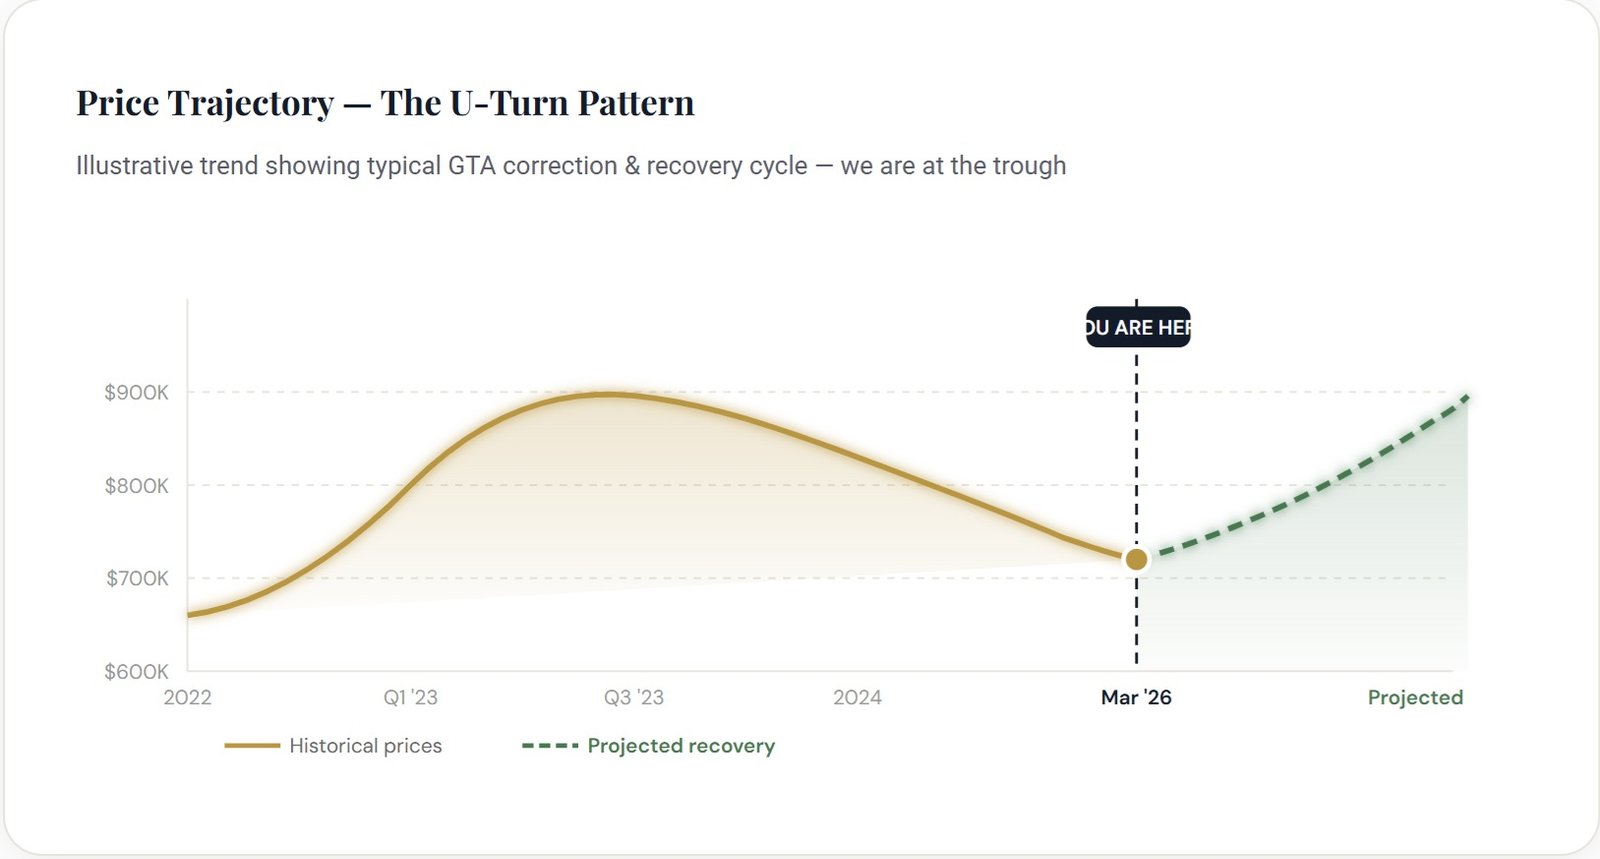
    Price Trajectory — The U-Turn Pattern
    Illustrative trend showing typical GTA correction & recovery cycle — we are at the trough
    $600K $700K $800K $900K YOU ARE HERE 2022 Q1 ’23 Q3 ’23 2024 Mar ’26 Projected Historical pricesProjected recovery
    🔍 Deep Analysis

    What the Data Is Really Telling You

    🏷️

    Prices Have Found Their Floor

    The median price climbed 2.0% from February to March 2026 — the first meaningful month-over-month increase in this correction cycle. When the bottom starts holding, recovery follows. This is the moment before the window closes.

    📦

    Maximum Inventory, Maximum Choice

    New listings surged 43.7% month-over-month to 31,476 — the highest supply of 2026 so far. Buyers today have the widest selection of homes at the lowest prices of the current cycle. This dual advantage won’t last.

    Transactions Exploding — Demand Is Back

    10,928 transactions in March — up 30.7% from February. Other buyers have already done the math. When transaction volume spikes this sharply before a sustained price recovery, it signals the turning point with high reliability.

    ⏱️

    Properties Selling Faster

    Median days on market dropped to just 23 days — down 8% from February. Homes are moving. The narrative of “nobody is buying” simply does not match the data. The active buyers are competing; the passive ones are watching.

    📐

    Sale-to-List Ratios Strengthening

    Average SP/LP ratio rose to 98.0% from 97.5% — sellers are recovering pricing power. Meanwhile, only 18.1% of homes still sell above asking. Act before that number climbs back toward the 24%+ we saw last year.

    📉

    YTD Prices Still 5.6% Below Last Year

    Year-to-date average prices are $812,011 vs. $859,908 last year — a $47,000 discount. For every month you delay, you risk buying that same home for $40-50K more as the recovery solidifies and competition returns.

    📋 Side-by-Side

    Now vs. Last Year vs. YTD

    The full picture — every major KPI compared across timeframes.

    MetricMar 2026 (Now)Mar 2025 (YoY)YoY Change
    Average Sale Price$823,467$868,446↓ 5.2% — Buy at discount
    Median Sale Price$700,000$737,000↓ 5.0% — Save $37K vs. last yr
    Transaction Volume10,92811,061↓ 1.2% — Near-parity, demand back
    New Listings31,47634,421↓ 8.6% — More demand per listing
    % Above List Price18.1%24.3%↓ 25.4% — Less bidding war risk
    % Below List Price77.0%69.7%↑ 10.5% — Negotiating power is yours
    Avg Days on Market4035↑ 15% — Time to decide thoughtfully
    Avg SP/LP Ratio98.0%99.1%↓ 1.1% — Offer under asking, win deals
    Median Days on Market23 days20 days↑ 15% — Less pressure, more clarity
    🧭 Market Pulse

    Where Is the Needle Right Now?

    Buyer vs. Seller Conditions
    BUYER’S SELLER’S BUYER Leaning Buyer

    77% of homes sell below ask. Conditions favour negotiation.

    Months of Inventory Available
    ~2.9 months supply Above 2.5 = buyer advantage

    Balanced market is typically 2–3 months. We’re at the edge — act now.

    ⏰ The Case for Acting

    5 Reasons the Window Is Closing

    Every correction in Canadian real estate history has reversed. Here is exactly why 2026 Q1–Q2 is the inflection point.

    01

    Rate Cuts Are Here

    The Bank of Canada has been reducing rates — lower borrowing costs directly translate into higher purchasing power and renewed demand that pushes prices up.

    02

    Transaction Volume Already Spiking

    A 30.7% MoM jump in sales means the crowd is already moving. In past cycles, this level of volume re-entry preceded 15–20% price appreciation within 12–18 months.

    03

    Population Growth Unchanged

    Canada adds 400,000+ new permanent residents annually. The GTA absorbs the majority. Structural demand for housing has not changed — only the sentiment has.

    04

    Median Price Already Rising

    Median price climbed 2.0% from February to March alone. The floor may be in. Waiting another quarter could mean buying at $730K instead of $700K — a $30K premium for hesitation.

    05

    Days on Market Compressing

    Average DOM fell from 46 to 40 days in one month. Median DOM is just 23 days. Inventory is being absorbed faster — the choice you have today won’t exist by summer.

    📅 Pattern Recognition

    The GTA Correction & Recovery Playbook

    History doesn’t repeat, but it rhymes — and the rhyme scheme is very recognizable.


    Phase 1 — Peak & Rate Shock (2022)

    Prices hit all-time highs. Rate hikes begin. Sentiment cools sharply. Volume drops. Headlines scream “crash.”


    Phase 2 — Correction (2023–2024)

    Average prices fall 15–20% from peak. Days on market extend. Sellers reduce. Inventory rises. Fear is maximum. This is also when the best deals are made.


    Phase 3 — Accumulation / Base (NOW — Early 2026)

    Prices stabilize. Transactions re-accelerate. Volume surges. Smart money enters. Days on market start falling. Median price makes first MoM gain. This is exactly where March 2026 data puts us.


    Phase 4 — Recovery & New Run (2026–2027, Projected)

    Rates stabilize lower. Immigration-driven demand re-engages. Competition returns. Bidding wars re-emerge. Prices recover toward prior peaks and beyond. Those who bought in Phase 3 benefit most.

    “The time to buy real estate is when nobody wants it — and the data says that moment is right now in the GTA.”
    — A.Q. Mufti, REALTOR® · aqmuftirealty.com
    🏡 For Sellers

    What This Means If You’re Selling

    The 43.1% spike in terminations this month tells a story: overpriced listings are being withdrawn. Sellers who price strategically — anchored to real comps, not wishful thinking — are selling in 23 days at 98% of asking. The market rewards precision, not ambition.

    Here is what a smart seller does right now:

    🎯

    Price to the Median

    List at or just below the $700K median and you attract the most buyer demand in the current market. Overpricing into the top 25% gets you into termination territory.

    🕐

    Timing Is Your Friend Now

    Spring market is arriving. With inventory rising and buyers flooding back, a well-presented, properly priced home listed in April–May 2026 will benefit from seasonal demand.

    💬

    Negotiate From Strength

    97.5% YTD average SP/LP ratio means sellers who price correctly receive near-full-asking offers. Position correctly and you aren’t leaving money on the table.

    ❓ Frequently Asked

    Questions Buyers Are Asking Right Now

    Is now actually a good time to buy in Mississauga?

    Yes — with significant nuance. Median prices are 5% below last year, you have maximum negotiating leverage (77% of homes sell below asking), and transaction volume is accelerating sharply. The combination of lower prices, softer competition, and rising demand signals this is near the optimal entry point of the current cycle.

    Will GTA home prices go down further in 2026?

    Possibly modestly — but the March 2026 data strongly suggests a floor is forming. Median prices rose 2% month-over-month for the first time this cycle. More importantly, the risk of waiting is asymmetric: if prices recover (as history shows they do), buyers who waited miss significant appreciation. The expected upside outweighs the risk of a small further dip.

    What type of property offers the best value in the current market?

    Properties priced below the $700K median threshold — particularly townhomes, semi-detached, and condos with outdoor space — represent the strongest value. These attract the widest buyer pool on the way back up, maximizing resale appreciation. Contact A.Q. Mufti for a personalized analysis based on your budget.

    How much can I negotiate off the asking price right now?

    With 77% of homes selling below list and an average SP/LP of 98%, there is typically 2–5% room for negotiation on well-priced homes. On overpriced or sitting listings, discounts of 5–10% are achievable. Your realtor’s negotiation strategy makes a significant difference — this is exactly where working with an experienced agent like A.Q. Mufti pays for itself many times over.

    Take the Next Step

    Ready to Buy at the Bottom of the Cycle?

    Don’t wait for the headlines to confirm what the data already shows. Book a free, no-obligation strategy session with A.Q. Mufti and get a personalized market analysis for your situation.

    ⭐⭐⭐⭐⭐ Rated 5.0/5 on Google · 47 verified reviews · Serving GTA & Mississauga since 2009

    AQM

    A.Q. Mufti, REALTOR®

    Mississauga’s Trusted Real Estate Expert · aqmuftirealty.com

    With years of experience navigating the GTA market through multiple cycles, A.Q. Mufti provides his clients with data-driven guidance rooted in honesty and genuine care. Rated 5 stars on Google, he is known for transparency, market knowledge, and results. Whether you are buying your first home or your fifth investment property, you deserve an advisor who puts your interests first.

    📌 Disclaimer: This market analysis is based on TRREB data for March 2026 and is for informational purposes only. It does not constitute financial or legal advice. Past market performance does not guarantee future results. Always consult a licensed professional before making real estate decisions. A.Q. Mufti is a registered REALTOR® in Ontario, Canada.

    © 2026 A. Q. Mufti, REALTOR® · Mississauga, Ontario · All rights reserved · Data source: TRREB March 2026 Market Report


  • BOC Rate Cut Unleashes Prime GTA Real Estate Opportunity!

    BOC Rate Cut Unleashes Prime GTA Real Estate Opportunity!

    October 29, 2025

    By A. Q. Mufti, a RE/MAX Platinum Club real estate agent serving Mississauga, Oakville, Milton and the GTA


    GTA Real Estate Rate Cut opportunity

    The GTA Real Estate Rate Cut is here. Find out how A. Q. Mufti can help you maximize your buying power in Mississauga & Oakville.

    The Bank of Canada (BOC) just delivered some truly exciting news: a decisive rate cut. As your dedicated Realtor across Mississauga, Oakville, Milton, and the entire GTA, I’m here to tell you exactly why this shift is the opportunity you’ve been waiting for, whether you’re looking to purchase your dream home or make a smart investment.

    The Immediate Impact of the GTA Real Estate Rate Cut

    Today’s historic rate adjustment marks a pivotal moment, and its effect on the housing market is both immediate and profound.

    The primary link is the cost of borrowing:

    • Lower Mortgage Rates: The BOC rate influences the prime rate, which in turn directly affects variable-rate mortgages and fixed-rate mortgage pricing. This decrease means your monthly mortgage payments will be lower, instantly improving affordability for potential buyers.
    • Increased Buyer Confidence: Lower borrowing costs remove a significant barrier for many on the sidelines. This influx of demand will revitalize the market, transforming today’s cautious atmosphere into a landscape ripe with possibility.
    • Affordability Boost: For a region like the GTA, where housing prices are high, even a small reduction in the interest rate can save tens of thousands of dollars over the life of a mortgage. This financial freedom allows more families to achieve their goal of homeownership in areas like Mississauga and Oakville.

    Seize the Opportunity: Your Next Steps

    This rate cut is the official signal that the market momentum is shifting. Now is the time to act—but you need expert guidance to navigate this change effectively. I am here to advise you.

    1. For Homebuyers: Finding Your Dream Home

    This change puts buying a home within easier reach. The rate reduction increases your purchasing power.

    • Act Now: Do not wait for the market to fully absorb this news, as competition and prices will likely rise as buyer confidence builds. Now is the moment to lock in a favourable rate and secure your property.
    • Mortgage Pre-Approval: Contact your lender immediately to update your pre-approval based on the new rates. Knowing your true budget is essential.
    • Targeted Search: Whether you seek the suburban charm of Milton or the vibrant life of Mississauga, we will strategically target homes that meet your updated budget and lifestyle needs.

    2. For Investors: Making Smart Moves in the GTA

    Real estate remains a phenomenal long-term investment, and this rate cut makes borrowing capital cheaper, boosting your return on investment (ROI).

    • Leverage is Cheaper: Cheaper mortgages mean higher potential yields and easier cash flow. Consider investment properties in high-growth corridors around Oakville or emerging areas within the GTA.
    • Diversify Your Portfolio: Investors can now explore opportunities in different housing types, from pre-construction condos to single-family rental homes. I provide data-driven insights to help you choose the best asset. Learn more about Investment Opportunities in the GTA (Internal Link: https://www.aqmuftirealty.com/gta-investment-opportunities)
    • Long-Term Growth: Real estate in the GTA has consistently offered strong appreciation. Buying now, before the next wave of market growth, positions you for success.

    Why Choose A. Q. Mufti?

    I’m not just a realtor; I am your dedicated advisor and partner in the GTA real estate market. My deep expertise in Mississauga, Oakville, and Milton ensures that you receive:

    • Local Mastery: Unrivalled knowledge of neighbourhood trends, future development, and hidden value.
    • Strategic Negotiations: Utilizing today’s market shift to negotiate the absolute best price for you.
    • Client-First Focus: Your dreams are my priority. I deliver personalized service and transparent advice.

    The opportunity is knocking. Don’t let this rate cut be a missed moment. Let’s discuss your strategy today and turn this financial advantage into the key to your next home or successful investment.

    Contact A. Q. Mufti today!

    If you found this review helpful, I would greatly appreciate it if you could kindly leave a Google Review for my real estate services: A. Q. Mufti Google Review

    Thank you for your continued support!

    A. Q. Mufti

    Your trusted Realtor in Mississauga, Oakville, Milton, and the GTA.

    Phone: 416-908-5600

    Email: info@aqmuftirealty.com

    Meet A. Q. Mufti, Your GTA Realtor: https://www.aqmuftirealty.com/about-aq-mufti

    Read the Official Bank of Canada Statement: https://www.bankofcanada.ca/2025/10/fad-press-release-2025-10-29/

    For more news and articles like this, go to https://aqmuftirealty.com/mississauga-real-estate-market-trends-investment-insights/

    What is the significance of the Bank of Canada rate cut for GTA real estate?

    The Bank of Canada’s rate cut reduces borrowing costs, lowers mortgage rates, boosts buyer confidence, and increases affordability, leading to a more active market in the GTA.

    How does the BOC rate cut affect mortgage rates and monthly payments?

    The rate cut influences the prime rate, which directly decreases fixed and variable mortgage rates, resulting in lower monthly mortgage payments for homebuyers.

    What should potential homebuyers do in response to the rate cut?

    Homebuyers should act quickly by obtaining mortgage pre-approval based on the new rates and start targeted property searches to secure a home before prices and competition rise.

    How can real estate investors benefit from the recent BOC rate cut?

    Investors can leverage cheaper financing to enhance yields, diversify their property portfolios, and capitalize on the GTA’s long-term growth potential.

    Why should I contact A. Q. Mufti now?

    A. Q. Mufti offers local expertise, strategic negotiation skills, and personalized guidance to help you maximize the opportunities created by the rate cut in the GTA real estate market.

  • 2025 Budget: A Transformative Leap for Mississauga Families

    2025 Budget: A Transformative Leap for Mississauga Families

    Carney Budget 2025
    Carney Budget 2025

    As a RE/MAX Platinum Club real estate agent serving Mississauga, Oakville, Milton and the GTA, I, A. Q. Mufti, Sales Representative, don’t just follow housing data — I study the pulse of policy.
    Because behind every mortgage payment, renovation, or investment lies a deeper story: one of security, resilience, and human aspiration.

    The newly unveiled Carney Government Budget 2025 marks a transformative shift for Canadian families.
    It’s bold, empathetic, and — most importantly — focused on real relief.
    Here’s how these historic measures will shape our lives, our homes, and the financial heartbeat of Mississauga.

    1 – CRA Automatic Tax Filing: The Dawn of Effortless Access

    The launch of CRA’s automatic tax filing system is not just administrative convenience — it’s an act of financial empowerment.
    Millions of Canadians who once fell through bureaucratic cracks will now be seen, supported, and strengthened.

    Why This Is a Game-Changer for Homeowners

    • Financial Liberation:
      For countless families, the dread of missing out on benefits like the GST/HST credit ends here. This system delivers guaranteed access to funds that ease anxiety and rebuild confidence.
    • Restored Dignity:
      Financial security brings peace of mind, and peace of mind creates better homes — emotionally and physically.
    • Expanding Reach:
      Starting with 1 million Canadians this year and expanding to 5.5 million by 2028, this initiative cements inclusion, equity, and trust as cornerstones of the new economy.
      👉 Learn more about CRA Automatic Tax Filing

    2 – The National School Food Program: Compassion with Consequence 🍎

    The now permanent National School Food Program brings both emotional relief and measurable financial value.
    Feeding over 400,000 children nationwide, it reflects Canada’s unwavering commitment to nurturing hearts as well as minds.

    The Homeowner’s Perspective

    • Stability Through Savings:
      For a family of four, this program delivers up to $800 in annual grocery relief — a meaningful difference in an era of relentless inflation.
    • Emotional Uplift:
      Parents can exhale, knowing their children are nourished and cared for during the school day. That comfort radiates into stronger communities and greater buyer confidence in neighbourhoods like Iroquois Ridge, Central Erin Mills, and River Oaks.
    • Community Magnetism:
      Policies rooted in compassion don’t just ease hardship — they enhance desirability. A family-oriented, socially responsible community always commands stronger real estate value.

    3 – Canada Strong: Reigniting Pride and Shared Purpose 🇨🇦

    The return of the Canada Strong Pass is more than a perk — it’s a cultural revival.
    With discounted access to parks, museums, and heritage sites, this initiative restores connection, optimism, and belonging.

    Impact on the Real Estate Landscape

    • Enhanced Livability:
      Homes are not only bricks and walls — they are emotional sanctuaries. When leisure and learning are accessible, the quality of life soars, and with it, the perceived value of your home.
    • National Pride Reborn:
      This investment in our shared identity strengthens community cohesion — the invisible foundation of every resilient real estate market.

    The Bigger Picture: A Secure Future for Mississauga

    These reforms don’t just manage costs — they rekindle confidence, rebuild stability, and unlock momentum in local markets.
    Every dollar saved in household expenses creates purchasing power, liquidity, and hope — the real forces behind sustainable growth.

    For buyers, this means renewed opportunity.
    For sellers, it signals stronger demand.
    And for the community, it represents a collective stride toward balance, dignity, and shared prosperity.

    Act Strategically. Move Confidently. Live Fully.

    The Carney Budget 2025 is more than an economic plan — it’s a roadmap to resilience.
    As your trusted Mississauga Realtor, I’m here to translate these changes into an actionable real estate strategy.

    Whether you’re upgrading, downsizing, or investing, this is the time to align your goals with a market that’s regaining strength.

    👉 Start your strategic journey today. Let’s turn these national breakthroughs into your personal success story.

    As your trusted Mississauga Realtor, I view this budget as a powerful signal of enduring opportunity.
    Whether you’re planning to buy, sell, or invest, understanding these economic shifts can elevate your financial strategy and protect your future.

    👉 Let’s connect to map your next move—strategically, confidently, and successfully.

    Start Your Strategic Real Estate Journey Today!

    Your Feedback Builds Our Community

    If this insight brought clarity or confidence, I’d be grateful for your feedback.
    Please share your experience in a Google Review for A. Q. Mufti.

    Thank you for your continued trust and engagement.

    A. Q. Mufti

    Your trusted and RE/MAX Platinum Club real estate agent serving Mississauga, Oakville, Milton and the GTA. For more news and articles like this, go to https://aqmuftirealty.com/mississauga-real-estate-market-trends-investment-insights/

  • Bank of Canada Rate Cut: A Prime Time to Invest

    Bank of Canada Rate Cut: A Prime Time to Invest

    Historic Rate Cut: A Powerful Shift for Real Estate

    Bank of Canada Cuts Rate to 2.5% — Why This Could Be the Best Time to Buy Real Estate
    Bank of Canada Cuts Rate to 2.5% — Why This Could Be the Best Time to Buy Real Estate

    The Bank of Canada’s rate cut for real estate conversation just became reality. According to The Toronto Star, the Bank has cut its key interest rate by 0.25%, bringing it down to 2.5%.
    This dramatic move is more than a technical adjustment. It’s a rare and emotional turning point that can unlock opportunity for buyers and sellers across Canada.

    Lower Rates Mean Immediate Benefits

    When rates drop, mortgage costs fall. This gives families and investors a burst of confidence because they can:

    • Secure lower monthly payments on the same home
    • Qualify for a larger mortgage with the same income
    • Enter the market before prices rise as demand increases

    For background on how rate changes affect loans, visit the Bank of Canada’s monetary policy page.

    Why Real Estate Becomes Especially Attractive Now

    Every rate cut is a signal, but this one is especially powerful. Lower borrowing costs, combined with Canada’s strong housing fundamentals, can create:

    • A surge in buyer interest
    • Quicker sales cycles for sellers
    • Opportunities for investors to build wealth through appreciation

    For market statistics, see the Canadian Real Estate Association.

    How to Act on This Moment

    Because this is a timely window, it helps to:

    1. Get Pre-Approved Now: Lenders update offers fast.
    2. Work with a Licensed Realtor®: Guidance is essential in a dynamic market.
    3. Think Long-Term: Rate cuts can drive price growth; an appreciation plan, not just today’s discount.

    What Sellers Need to Know

    Sellers also benefit. More qualified buyers mean faster offers and, potentially, stronger selling prices. If you’ve been waiting to list, this shift can be your moment.

    Lessons from This Rate Cut

    • Data and inflation reports can prompt swift policy adjustments.
    • Real estate remains one of Canada’s most resilient assets.
    • Acting early in a rate-cut cycle can deliver the biggest advantage.

    FAQs (SEO-Friendly)

    Q1: How will the Bank of Canada’s rate cut to 2.5% affect mortgage rates?
    A1: Lenders usually lower their prime rates after a Bank of Canada cut, making many mortgages cheaper.

    Q2: Is now a good time to invest in Canadian real estate?
    A2: Historically, the early phase of a rate-cut cycle is the best time to buy before demand pushes prices higher.

    Q3: Should sellers list their homes after a rate cut?
    A3: Yes. More qualified buyers often lead to quicker sales and stronger offers.

    Q4: Where can I learn more about the Bank of Canada’s decisions?
    A4: Visit the Bank of Canada’s official site for updates.

    If you found this review helpful, I would greatly appreciate it if you could kindly leave a Google Review for my real estate services: A. Q. Mufti Google Review

    Thank you for your continued support!

    A. Q. Mufti

    Dir: 416-908-5600

    E-Mail: info@aqmuftirealty.com

    Profile: http://www.muftiestates.com/about_me/25723

    Your trusted Realtor in Mississauga, Oakville, Milton, and the GTA. For more news and articles like this, go to https://aqmuftirealty.com/mississauga-real-estate-market-trends-investment-insights/

  • BOC Rate Cut: A Prime Time to Invest in Real Estate

    BOC Rate Cut: A Prime Time to Invest in Real Estate

    A Window Of Opportunity For Real Estate Investors
    A Window Of Opportunity For Real Estate Investors

    Introduction

    Prime Time to Invest in Real Estate. The Bank of Canada (BOC) is widely expected to cut its policy interest rate at its upcoming meeting — a move prompted by a fresh inflation report, a weakening job market, and ongoing uncertainty over trade and government spending. (Investment Executive) For many Canadians, this is more than just monetary policy—it could be an opportunity. If you’ve been contemplating investing in real estate, the shifting landscape could make this a strategic time to act to invest in real estate.

    What’s Driving the Expected Rate Cut

    • Inflation held steady in August, rising to 2.0% from 1.7% in July. Economists say food and energy prices contributed to the uptick. (Investment Executive)
    • The Canadian economy contracted in Q2, and job growth has been weak. These signs suggest less overheating in the economy. (Investment Executive)
    • Ottawa has changed its tariff stance, reducing or removing retaliatory tariffs in early September. Combined with government spending uncertainty, this has eased some inflation pressure. (Investment Executive)
    • Financial markets are pricing in a 25-basis-point cut to the policy rate, potentially bringing it to ~2.50%. Some forecasts see another cut later in the year. (Investment Executive)

    BOC Rate Cut: A Prime Time to Invest in Real Estate. Why This Matters for Real Estate Investors?

    Lower Mortgage Rates = More Buying Power

    Once the Bank of Canada lowers the policy rate, interest rates on fixed and variable mortgages tend to follow—or at least ease. That can reduce monthly payments for new buyers or refinancers. If you invest now, you might lock in more favourable financing terms.

    More Affordable Carrying Costs

    Smaller interest payments mean that holding onto investment properties (condos, houses, rentals) is less expensive. That increases net returns, especially in markets with stable or rising demand.

    Stimulus for Demand

    Rate cuts often boost consumer confidence. More people may feel comfortable buying homes, increasing demand—and potentially driving up property values. For sellers or those holding real estate assets, that’s a positive trend.

    Timing Window

    If the BoC cuts rates in September and perhaps again later, waiting could mean missing out on the “early mover” advantage. Rates often rise in anticipation of inflation or economic strength, so buying before rates begin climbing again could be wise.

    Key Risks & What to Watch

    • If inflation stays stubbornly high, the BoC might delay or limit cuts.
    • External pressures like trade disruptions or fiscal policy shocks could derail expectations.
    • Local market factors—supply, zoning, taxes—still matter a lot. National trends help, but real estate is local.

    Tips to Invest Smartly in This Environment

    1. Get your financing lined up now — speak with mortgage brokers while rates are expected to drop.
    2. Focus on properties with strong cash flow — rentals in stable neighbourhoods, multi-units.
    3. Watch for undervalued or distressed assets that may benefit from an uptick.
    4. Consider long-term hold — rate cuts bring relief, but inflation, property maintenance, and taxes still chip away.

    Final Thoughts

    In short, the anticipated interest rate cut from the Bank of Canada may mark one of the better windows to invest in real estate in recent years. For many potential buyers and investors, this shift could lower cost barriers, improve returns, and offer a more favourable financing environment.

    If you’ve been on the fence about entering the real estate market—or expanding your portfolio—this could be the moment to make a move.

    If you found this review helpful, I would greatly appreciate it if you could kindly leave a Google Review for my real estate services: A. Q. Mufti Google Review

    Thank you for your continued support!

    A. Q. Mufti

    Your trusted Realtor in Mississauga, Oakville, Milton, and the GTA.

    For more news and articles like this, go to https://aqmuftirealty.com/mississauga-real-estate-market-trends-investment-insights/

    FAQs:

    Q1: When will the Bank of Canada cut rates?
    A: Economists expect a 25-basis-point cut at the next meeting.

    Q2: How will this impact mortgage rates?
    A: Lower policy rates generally lead to lower fixed and variable mortgage rates, reducing monthly payments.

    Q3: Should I buy now or wait?
    A: Buying now may help you lock in lower rates and get ahead of increased demand.

  • Why Mississauga Leads Canada in Happiness

    Why Mississauga Leads Canada in Happiness

    Mississauga, the happiest city in Canada
    Mississauga, the happiest city in Canada

    A recent national survey—the Leger Happiness Index—presents a revealing portrait: Toronto ranks last among Canada’s 10 largest cities, with a score of 65.8/100, which is well below the national average of 68.7. (The Star) While Toronto remains vibrant and dynamic, everyday stresses like congestion, sky-high housing costs, and urban density may be dragging down perceived well-being.

    Spotlight on Mississauga: Canada’s Happiest Major City

    In contrast, Mississauga scored a leading 70.3/100, earning the title of Canada’s happiest major city.

    Several key factors drive this distinction:

    1. Strong Quality of Life Across the Board
      According to Mississauga’s own Citizen Satisfaction Survey (2023), 79% of residents rate their quality of life as excellent or good, with 85% feeling the city is open and welcoming, and 80% proud to call Mississauga home.
    2. Outstanding Public Services and Safety
      The city boasts low crime rates and high satisfaction (85%) with fire and emergency services. Mississauga benefits from Trillium Health Partners’ robust network, which includes three top hospitals, providing excellent healthcare access.
    3. Green Spaces, Arts & Community Events
      With 519 parks, 393 km of trails, 22 km of waterfront, and cultural venues like Celebration Square and the Art Gallery of Mississauga, the city offers accessible and engaging public spaces.
    4. Cultural Diversity & Festivals
      Home to people from over 145 countries and more than 53% born outside Canada, Mississauga thrives on multicultural richness. Festivals like Carassauga showcase that diversity, celebrating global cultures through food, music, and art.
    5. Economic Strength & Convenience
      Hosting over 60 Fortune 500 headquarters and a thriving economy, the city offers abundant job opportunities. Coupled with proximity to Toronto and Pearson International Airport, it’s both economically vibrant and conveniently located.

    What Residents Say: The Unfiltered View.

    Reddit users share real-life experiences that echo the survey data:

    “The people here are some of the nicest people I’ve ever met… a woman pulled over to make sure I was safe.”

    “I love my lifestyle … by Square One. I’ve made so many memories in the Square… discovering street eats and cultural music.”

    These personal stories highlight how community warmth, safety, and accessible amenities foster genuine happiness.

    Lessons from the Data: Why Mississauga Works

    When combined, the following factors help explain Mississauga’s top ranking in happiness:

    • High satisfaction with services and governance
    • Safety and robust healthcare infrastructure
    • Vibrant green and cultural spaces accessible to all
    • Economic opportunity and urban convenience
    • Inclusive and diverse community fabric

    For Toronto and Beyond: Paths to Greater Happiness

    • Invest in Public Spaces & Community Events: Expanding neighbourhood-friendly squares, parks, and arts hubs can help replicate Mississauga’s sense of belonging and vibrancy.
    • Improve Accessibility & Safety: Ensuring equitable access to healthcare and transit—while maintaining public safety—can boost overall satisfaction.
    • Cultivate Community Connections: Programs that celebrate cultural diversity and civic pride can enhance well-being city-wide.

    If you found this review helpful, I would greatly appreciate it if you could kindly leave a Google Review for my real estate services: A. Q. Mufti Google Review

    Thank you for your continued support!

    A. Q. Mufti

    Your trusted Realtor in Mississauga, Oakville, Milton, and the GTA.

    For more news and articles like this, go to https://aqmuftirealty.com/mississauga-real-estate-market-trends-investment-insights/

A. Q. Mufti, REALTOR® — Mississauga, Oakville, Milton and the GTA49 Google reviews
Let's Connect!