Transactions Surge 9.4% — Smart Buyers Act Now
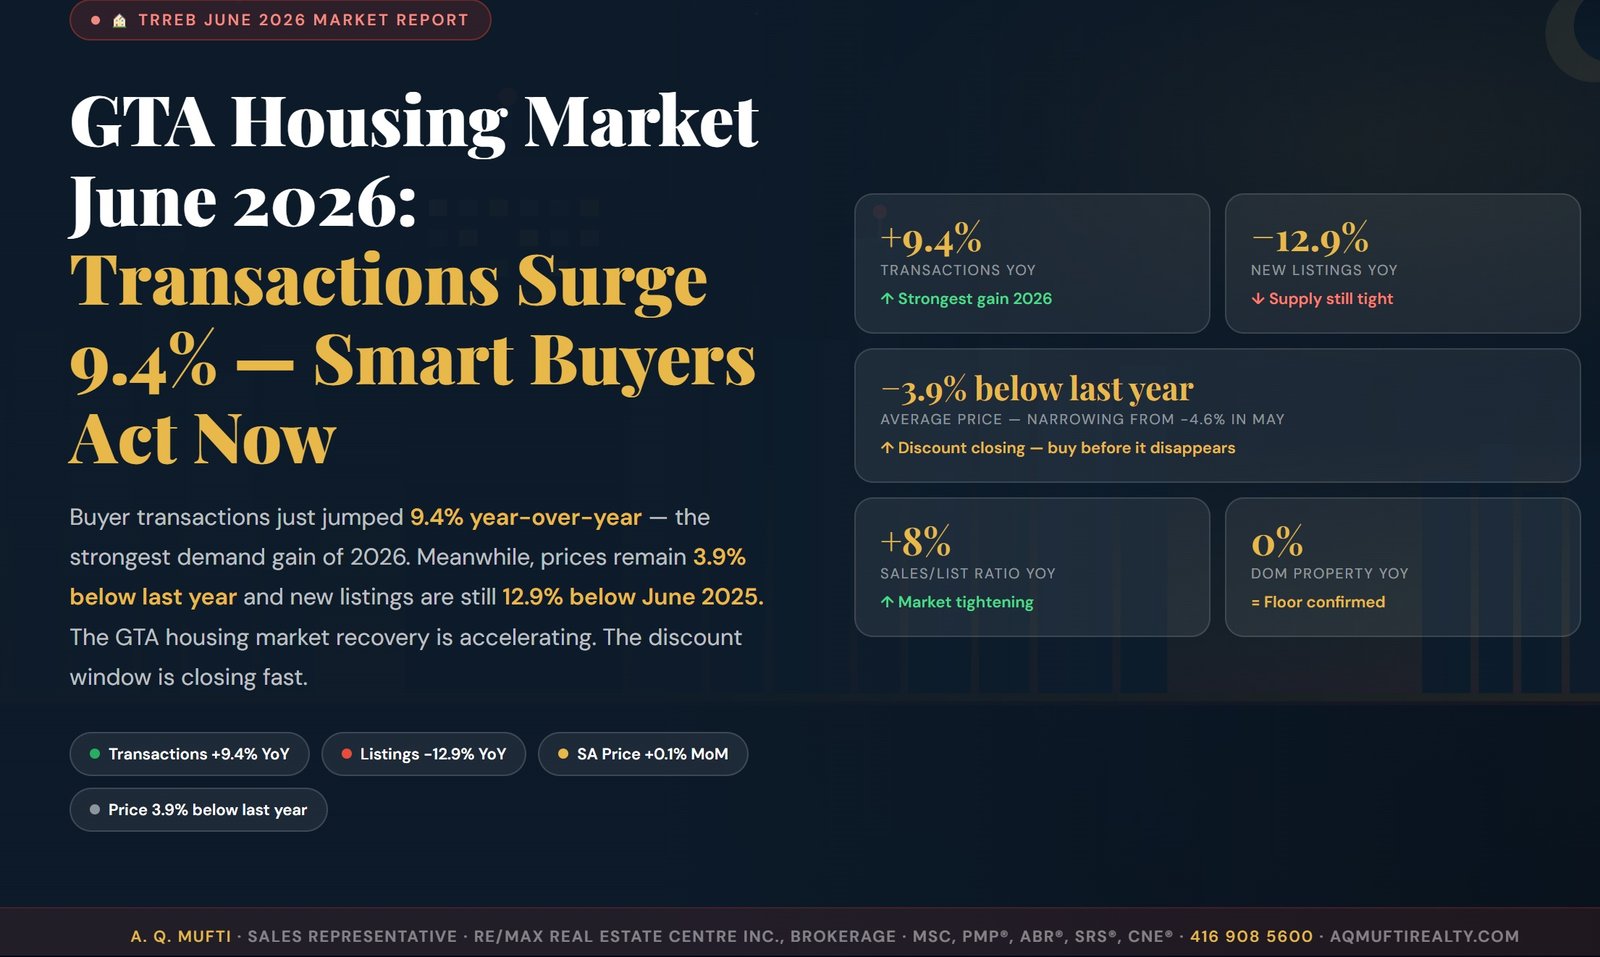
The June 2026 report shows home sales just jumped 9.4% from a year ago. That is the strongest demand gain of 2026. Meanwhile, prices are still 3.9% below last year, and new listings are still 12.9% below June 2025. The GTA housing market recovery is picking up speed. The discount window is closing fast.
The GTA housing market in June 2026 sent its strongest demand signal of this whole recovery. Home sales (TRREB calls them transactions) rose 9.4% from a year ago. That is a sharp step up from the 6.3% gain in May. At the same time, the price discount is shrinking. Prices were 4.6% below last year in May, and 3.9% below in June. So the recovery is not coming. It is already here.
Supply is still tight, and it is not getting better. New listings remain 12.9% below last year. Also, the sales-to-new-listings ratio rose 8% from a year ago. As a result, the gap between supply and demand that pushes prices up is growing, not easing. On top of that, days on market for homes is now flat from a year ago. That confirms the correction is over.
What This Report Covers: Your Complete June 2026 GTA Housing Market Breakdown
Below, I walk through each key number in the TRREB June 2026 Quick Market Overview. I cover homes, condos, rentals and commercial space, with clear steps for buyers and sellers. Also, each section compares June with May 2026. That way, you can see which way the market is moving, not just where it is.
This post was first published in July 2026. The figures below are from TRREB’s June 2026 report. For newer numbers, see my August 2026 price update. For the month before, read my May 2026 market report.
📅 Published: July 7, 2026 · ✍️ A. Q. Mufti, Sales Representative · RE/MAX Real Estate Centre Inc., Brokerage · 📍 Mississauga, GTA · ⏱ 9 min read
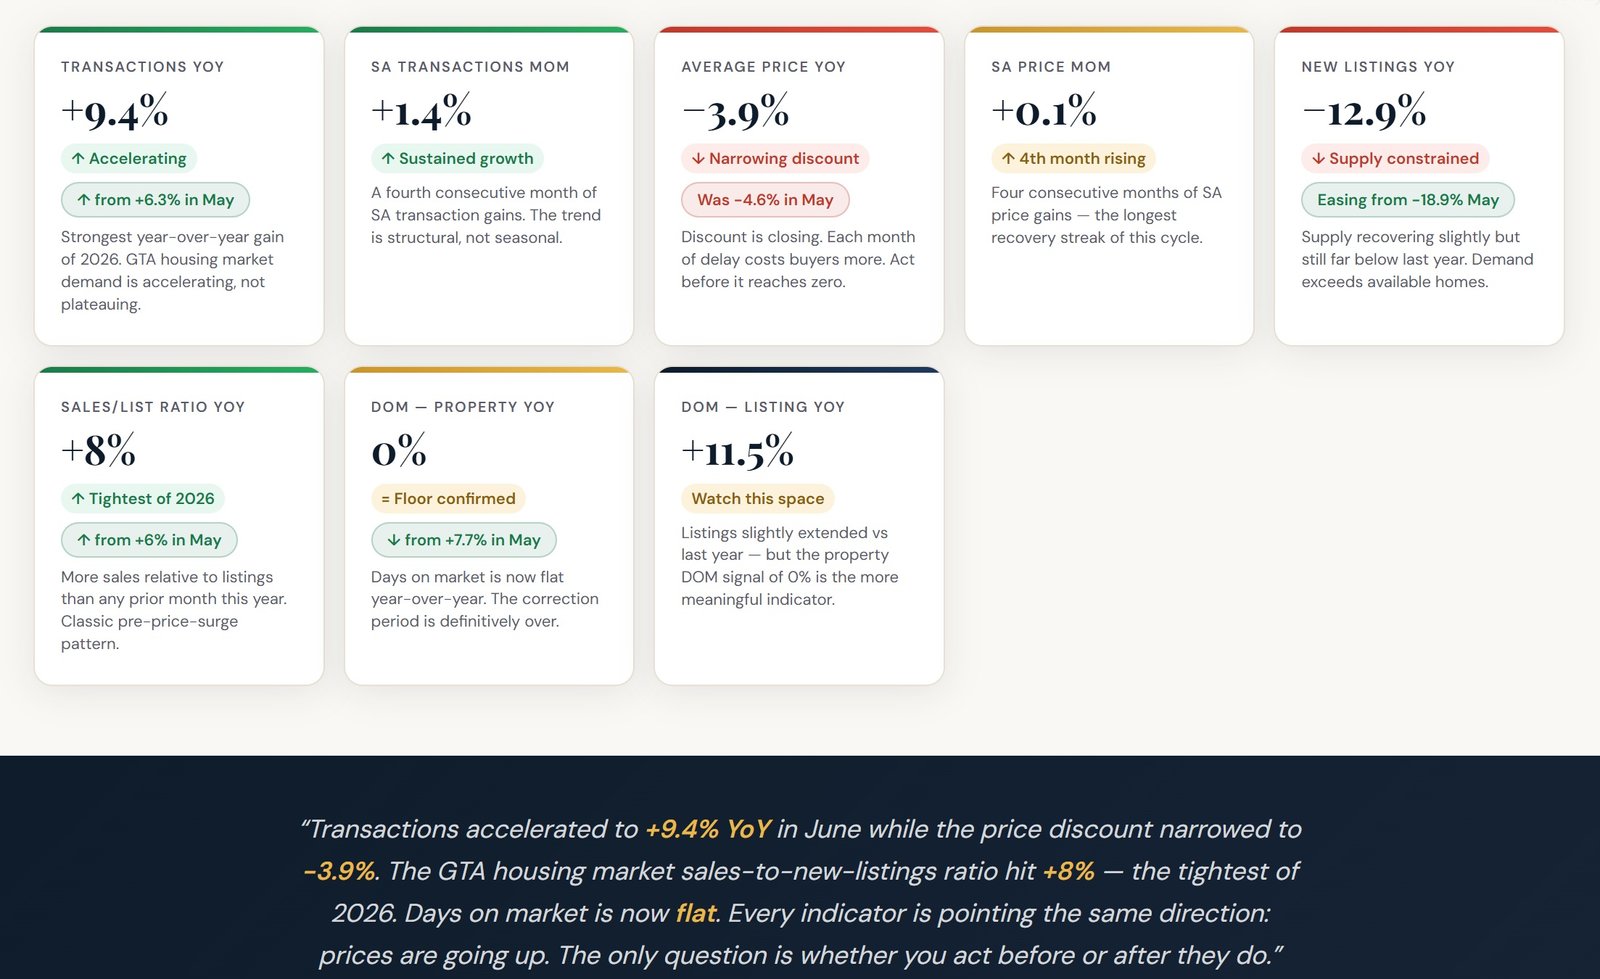
June 2026 GTA Housing Market: Eight Numbers That Define the Recovery
Each metric drawn directly from the TRREB June 2026 Quick Market Overview — compared to May 2026 to show the momentum.
“Transactions accelerated to +9.4% YoY in June while the price discount narrowed to -3.9%. The GTA housing market sales-to-new-listings ratio hit +8% — the tightest of 2026. Days on market is now flat. Every indicator is pointing the same direction: prices are going up. The only question is whether you act before or after they do.”
June 2026 GTA Housing Market — Full Data at a Glance
The chart below sums up each key June 2026 number from TRREB. It also shows the gains since May. Together, they show the GTA housing market recovery is gaining speed, not stalling.
Figure 1: TRREB June 2026 GTA housing market data summary with May 2026 comparison — A. Q. Mufti, RE/MAX Real Estate Centre Inc., Brokerage · Mississauga, ON
June 2026 GTA Housing Market — Momentum Visualized
Six GTA Housing Market Signals Decoded for June 2026
Each signal below comes straight from TRREB June 2026 data. And each one, compared with May, shows the recovery is speeding up.
Transactions Accelerated — Not Peaked
June 2026 sales rose 9.4% from a year ago. That is up from 6.3% in May and about 7% in April. This three-month climb is the clearest proof that buyer demand is built in, not seasonal. So if you are waiting for demand to level off before you buy, you are waiting for something that is moving the other way. And with supply still tight, this climb will only get stronger through Q3.
Price Discount Closing — From 4.6% to 3.9%
The average price gap narrowed from 4.6% below last year in May to 3.9% below in June. That is a real 0.7 percentage point gain in a single month. On an $800,000 home, that gap means $5,600 more in price than one month earlier. So every month of delay has a clear and growing dollar cost. Also, at the current pace, the discount reaches zero by Q3 2026.
Sales/List Ratio Hit +8% — Tightest of 2026
The sales-to-new-listings ratio rose 8% from a year ago in June, up from 6% in May. As a result, more homes are selling per listing than at any point this year. This ratio is the most reliable early sign of price pressure in the GTA housing market. And when it hits yearly highs while supply falls short, bidding wars tend to follow within 60 to 90 days.
Days on Market Flat — The Correction Is Over
Property days on market hit 0% change from a year ago, down sharply from 7.7% in May. This is the clearest sign yet that the correction has ended. So buyers who relied on long selling times to bargain no longer have that edge. Also, sellers can now price with more confidence, since homes are selling at the same pace as a year ago.
Condos Still the Deepest GTA Value
Condo prices remain 9.1% below the prior quarter. That makes condos the most discounted asset class in the GTA right now. Also, new condo listings dropped 19.4% QoQ, while rental demand jumped 10.6%. So condos still offer the best risk-adjusted total return for buyers and investors. A low entry price plus rising rent income makes this the clearest total-return chance of this cycle.
Four Consecutive SA Price Gains
The seasonally adjusted (SA) price has now risen for four straight months: March, April, May and June. This is the longest streak of the whole recovery. So the SA price trend is no longer a weak signal. It is a confirmed trend. And each new month of SA gains eats into the discount buyers enjoy today. In short, the entry window gets smaller with every report.
GTA Housing Market: June 2026 vs May 2026 vs June 2025
| Metric | June 2026 | vs May 2026 | vs June 2025 | Signal |
|---|---|---|---|---|
| Total Transactions | Above June 2025 | ↑ Accelerating | ↑ +9.4% | Demand at 2026 peak |
| Average Selling Price | Below June 2025 | ↑ Improving | ↓ -3.9% | Discount closing fast |
| SA Price MoM | Rising — 4th month | ↑ +0.1% | — | Longest streak 2026 |
| New Listings | Below June 2025 | ↑ Easing | ↓ -12.9% | Still tight — buy now |
| Sales/List Ratio | Tightest 2026 | ↑ +8% YoY | ↑ +8% | Pre-price-surge signal |
| DOM Property YoY | Flat — floor in | ↑ 0% | 0% | Correction definitively over |
| Condo Sales QoQ | Discounted | — | ↓ -11.3% | Best entry point |
| Condo Price QoQ | Deep discount | — | ↓ -9.1% | Buy low before recovery |
| Condo Rentals QoQ | Surging | — | ↑ +10.6% | Income rising |
| Commercial Leasing | Expanding | — | ↑ +12.4% | Jobs → housing demand |
GTA Housing Market Conditions — June 2026
Sales/list ratio at +8% YoY — tightest reading of 2026. Seller leverage building.
At this pace, the year-over-year price discount reaches zero in Q3 2026.
GTA Housing Market: Deeper Value and Leading Indicators
Condos remain the most discounted part of the GTA housing market. Meanwhile, commercial growth keeps pointing to the job gains that support home demand. Both trends support further price recovery through Q3 and Q4 2026. You can find the full data in TRREB’s Condo Market Report and TRREB’s Commercial Market Report.
🔑 Condo Rental Market — June 2026
💡 Investor insight: Condos offer buy-low conditions right now, with prices down 9.1% QoQ. Also, rising rental demand (up 10.6% QoQ) creates income right away. So total returns on condos, from rent plus a price rebound, look very strong for buyers who act in July 2026.
Commercial Real Estate — GTA Housing Market Leading Indicator
Commercial leasing tends to lead the GTA housing market by 6 to 12 months. When firms grow and hire, workers need homes. So the June 2026 commercial numbers below point to more demand for homes into late 2026 and 2027.
5 Powerful Reasons the GTA Housing Market Window Is Closing
Each reason below is based on June 2026 TRREB data.
Transactions Hit +9.4% — Accelerating
Sales growth in the GTA housing market has sped up every single month of 2026. As a result, competition among buyers is growing each month, not easing. A buyer who waits until August will face more competing offers than one who moves in July. Acting now means acting before the crowd catches up.
Price Discount Closed From 4.6% to 3.9%
The price discount from a year ago shrank by 0.7 percentage points in one month alone. On a $900,000 home, that is $6,300 more in price compared to June. So the cost of waiting is no longer a theory. It is a real dollar amount each month. And the gap is closing faster than most buyers realise.
DOM Is Now Flat — The Correction Is Over
Homes now sell at exactly the same pace as one year ago. The long selling times that gave buyers leverage all through 2025 are gone. So price expectations must reset to match today’s market. Also, sellers who see this shift are already changing their plans.
4 Consecutive SA Price Gains
Four SA price gains in a row is the longest recovery streak of this whole cycle. Past GTA housing market data shows that once a four-month SA price streak builds, it rarely reverses without a major outside shock. So month five will almost certainly extend the trend. And each gain adds to the shrinking discount buyers face.
Sales/List Ratio At 2026 High
A sales-to-listings ratio up 8% from a year ago is the tightest reading this year. When this ratio keeps rising while supply stays tight, bidding wars tend to return within 60 to 90 days. So July 2026 is the last real window before multiple offers heat up. In other words, waiting for September means competing in a very different market.
Where the GTA Housing Market Stands — July 2026 Update
Phase 1 — Peak Euphoria (2021–2022)
Prices hit record highs. Bidding wars on every listing. Rate hikes begin. Smart money quietly exits.
Phase 2 — Rate Shock and Correction (2022–2024)
Fast rate hikes cool demand. Prices fall 15–20% from the peak. Sales drop sharply. Fear peaks. A quiet chance forms for buyers who are ready.
Phase 3 — Base Building (Late 2025 – March 2026)
Prices level off. Sales pick up. The SA price posts its first gains. Smart buyers step in. Sales start to rise from a year ago.
The Recovery Phases That Matter Most for June 2026 GTA Housing Market Buyers
Phase 4A — Early Recovery (April–May 2026 — PASSED)
SA price gains begin. Transactions rise 7% then 6.3%. Listings crash 18.9%. The best entry point of the cycle — now behind us. Those who acted here benefited the most.
Phase 4B — Confirmed Recovery (June–July 2026 — RIGHT NOW)
This is where we stand. Sales rose 9.4% YoY. The price discount narrowed to 3.9%. DOM hit 0%, so the correction is over. The SA price has gained for four straight months. The GTA housing market is in a confirmed recovery. This is the last window of real discount.
Phase 5 — Full Recovery and Appreciation (Q3 2026 – 2028, Projected)
The price gap from a year ago reaches zero. Bidding wars return in the most sought-after segments. New buyers pay full prices after the recovery. Steadier rates speed up the timeline.
“June 2026 removed all remaining doubt. Transactions up 9.4%. Price discount narrowing. DOM flat. Four months of SA price gains. The GTA housing market has turned the corner — and the buyers who act in July are the last ones to enter at a discount.”— A. Q. Mufti, Sales Representative · RE/MAX Real Estate Centre Inc., Brokerage · 416 908 5600
GTA Housing Market Seller Strategy — June 2026
The June 2026 data gives sellers a much stronger hand. Sales are up 9.4%. The sales-to-listings ratio is at a 2026 high. And DOM is flat from a year ago. Also, new listings are still 12.9% below last year, so your home faces far less competition than 12 months ago.
According to CMHC’s Housing Supply Report, the long-term supply shortfall in the GTA housing market continues to support seller pricing power. However, precise pricing is still the single most important factor. So a disciplined, data-driven listing plan will beat hopeful pricing every time.
Leverage the +9.4% Demand Signal
In June, sales posted their biggest gain from a year ago in 2026. So your buyer pool is larger today than at any point this year. Also, the sales/list ratio, up 8%, shows these buyers are actually buying. That means a well-priced listing will draw real interest in July 2026.
Price to Current Recovery — Not Peak
The average price is still 3.9% below last year, so buyers know what a fair price looks like. They also have other choices, including condos at 9.1% below the prior quarter. So price your home on recent, verified sales nearby. Do not price it on your 2022 memory of what the market did.
List Now — Before Fall Competition Returns
Right now, new listings are 12.9% below last year. That is your window of lowest competition. However, sellers tend to flood the market in September. So listing in July lets your home gain from peak summer demand while few other homes compete. In short, this is your best timing window.
GTA Housing Market June 2026 — Your Questions Answered
Each answer is based on June 2026 TRREB data.
Is June 2026 a good time to buy a home in the GTA housing market?
Yes. June 2026 is one of the most compelling entry points in the GTA housing market this cycle. Sales rose 9.4% from a year ago, yet prices are still 3.9% below last year. Also, new listings are still 12.9% below June 2025, so tight supply keeps supporting prices. And the sales-to-new-listings ratio rose 8%, which shows the market is tightening fast. Buyers who act now lock in a discount that is fading fast.
Why did GTA housing market transactions jump 9.4% in June 2026?
Sales rose 9.4% from a year ago in June 2026, up from a 6.3% gain in May. The main driver is a long-running supply shortage. New listings remain 12.9% below last year, so buyers must compete for the homes that are for sale. Also, the sales-to-new-listings ratio rose 8% from a year ago, which shows buyers are taking up homes faster. So demand is built in and growing, not seasonal and short-lived.
Are GTA housing market prices still discounted in June 2026?
Yes. The average price is still 3.9% below June 2025, but this discount is shrinking. In May 2026 it was 4.6% below last year. In June it tightened to 3.9%, a 0.7 percentage point gain in one month. The direction is clear: the discount is closing. At the current pace, the price gap from a year ago reaches zero by Q3 2026. Buyers who act now pay less than those who wait.
Should I buy a condo in the GTA housing market in 2026?
Condos remain the most discounted asset class in the GTA housing market. Prices fell 9.1% from last quarter, while new condo listings dropped 19.4% QoQ. Meanwhile, condo rentals jumped 10.6% QoQ, which shows rental demand is strong even while prices stay low. That mix of lower prices and rising rent income creates a compelling entry point for investors and first-time buyers in summer 2026.
What does the 0% days-on-market change mean for the GTA housing market?
A 0% change in property days on market from a year ago is a key milestone. It means homes are selling at exactly the same pace as a year ago. Also, this is the first time in over two years that the DOM figure has returned to normal. So the long selling times that gave buyers leverage through 2024 and 2025 are gone. Buyers should no longer expect the time edge they had during the correction.
Ready to Enter the GTA Housing Market Before Prices Fully Recover?
Don’t face this key GTA housing market moment alone. Have a question about these numbers? Contact A. Q. Mufti, Sales Representative, RE/MAX Real Estate Centre Inc., Brokerage, or call 416 908 5600. You will get a free, no-obligation look at your budget, your neighbourhood and your timeline. Straight data. Sound strategy.
RE/MAX Real Estate Centre Inc., Brokerage · 141-1140 Burnhamthorpe Rd. W., Mississauga ON L5C 4E9 · Bus: 905 270 2000 · info@aqmuftirealty.com
A. Q. Mufti — Sales Representative
RE/MAX Real Estate Centre Inc., Brokerage · MSc, PMP®, ABR®, SRS®, CNE®A. Q. Mufti has worked through several GTA market cycles. He gives honest, data-backed advice, grounded in an MSc and designations in buyer representation (ABR®), seller strategy (SRS®) and negotiation (CNE®). His PMP® designation brings disciplined project management to every deal. He also knows Mississauga well, so clients get local, practical advice, not generic tips. Contact: 📞 416 908 5600 · 📱 905 270 2000 · ✉️ info@aqmuftirealty.com · 📍 141-1140 Burnhamthorpe Rd. W., Mississauga ON L5C 4E9.
📌 Disclaimer: This market analysis is based on the TRREB Quick Market Overview for June 2026 and is for informational purposes only. It does not constitute financial or legal advice. A. Q. Mufti is a registered Sales Representative at RE/MAX Real Estate Centre Inc., Brokerage, Ontario, Canada.