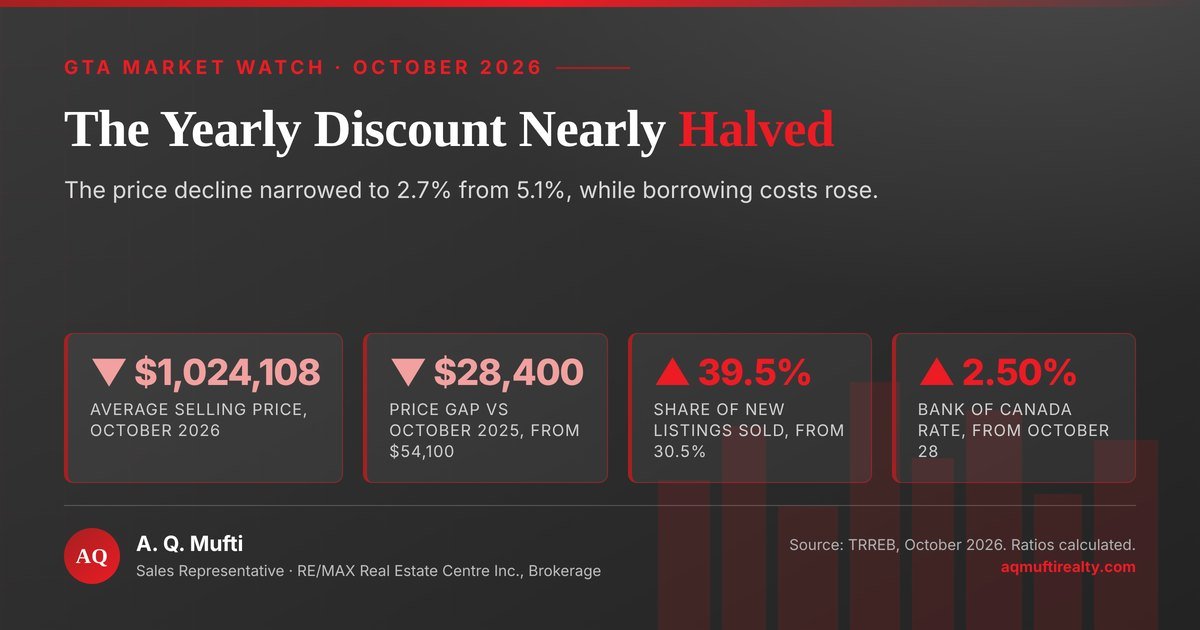
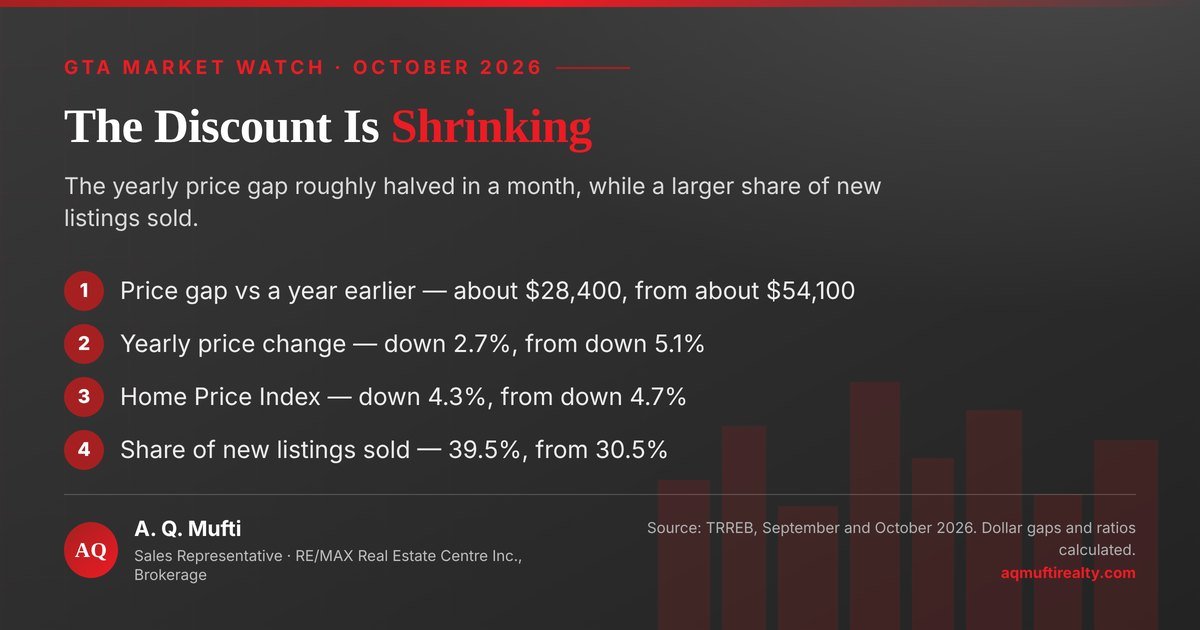
October 2026 at a glance, with the average selling price in context. Source: TRREB, October 2026. Ratios calculated.
The board report for October 2026 reads like another soft month, and the headline figures back that up. Yet the average selling price tells a different story once you set it beside September.
It slipped 2.7% against a year earlier. In September the same measure was down 5.1%. So the discount buyers have been negotiating against is closing, and it is closing while borrowing costs climb.
The short version
- The yearly discount roughly halved. First, the average selling price came in at $1,024,108, down 2.7%. One month earlier the drop was 5.1%.
- In dollars, that is the clearer way to see it. The gap against October 2025 shrank from about $54,100 to about $28,400 (calculated).
- Supply is clearing faster. Consequently 39.5% of new listings sold in October, against 30.5% in September (both calculated).
- Money got dearer at the same time. Notably, the Bank of Canada raised its policy rate to 2.50% on October 28, its first increase since July 2023.
- Two forces now pull against each other. Therefore the price cushion is thinning just as payments rise. December 9 is the next rate date.
October’s average selling price in numbers
First, here is October beside September and beside the same month a year ago. The average selling price line is the one that moved least, and that is the point.
| Measure | October 2026 | September 2026 |
|---|---|---|
| Home sales | 5,603 | 5,040 |
| Change in sales, year over year | -7.9% | -9.0% |
| New listings | 14,173 | 16,500 |
| Change in new listings, year over year | -11.9% | -14.4% |
| Average selling price | $1,024,108 | $1,006,409 |
| Change in price, year over year | -2.7% | -5.1% |
| MLS Home Price Index, year over year | -4.3% | -4.7% |
| Share of new listings sold | 39.5% | 30.5% |
| Price gap against a year earlier | about $28,400 | about $54,100 |
What the average selling price did in October
Start with the four figures the board published on November 4, 2026, because the story sits inside them rather than beside them.
The average selling price and three other figures
First, sales reached 5,603 across the region, down 7.9% from October 2025. New listings came to 14,173, down 11.9%. The MLS Home Price Index composite fell 4.3%. Finally, the average selling price landed at $1,024,108, down 2.7%.
So three of those four are familiar. Generally a reader stops at the first one and files the month as weak. However, the last one carries the better signal, because of how small it is.
Where the average selling price sits now
Measured against September, it rose about 1.8%, from $1,006,409 (calculated, and not seasonally adjusted). TRREB reports that on a seasonally adjusted basis both the index and the price “edged up month-over-month compared to September 2026”, which points the same way.
Still, the region sits above a million dollars on average. Therefore a buyer budgeting from last spring’s numbers is working from a figure that has stopped falling.
Why the average selling price decline is narrowing
Here is the mechanic worth two minutes. A yearly percentage change compares two moving points, so the gap can close from either end.
The average selling price, from 5.1% to 2.7%
In practice the drop nearly halved. September was 5.1% below its own 2025 figure; October was 2.7% below its own. The index moved the same way, from 4.7% down to 4.3%.
Admittedly these are single months, and one month proves little on its own. Even so, both measures narrowed together, which is harder to dismiss than either moving alone.
A discount that halved in dollars
Now put it in money, because that is what a buyer actually negotiates. October 2025 averaged roughly $1,052,526, so the gap this October was about $28,400 (both calculated).
By contrast September’s gap was about $54,100 (calculated). Hence roughly $25,700 of negotiating room disappeared in four weeks, measured on the regional average selling price.
Granted, an average is a blunt tool and the mix of homes sold shifts it. Nevertheless the index narrowed too, and the index controls for mix.
Meanwhile the cost of money moved the other way
Next, look at the other half of a monthly payment. A buyer pays for a home with price and with interest, and only one of those improved in October 2026.
What 2.50% changed on October 28
The Bank of Canada raised its policy rate to 2.50% on October 28, 2026, a quarter point higher, and its first increase since July 2023. Its next scheduled announcement falls on December 9, 2026.
Jason Mercer, the board’s chief information officer, read the two forces together. Buyers kept “substantial negotiating power on price over the past year”, he said in the October release, and lower prices had been “helping keep affordability in check” as borrowing costs rose.
Equally, that trade stops working once the price side stops giving. Consequently the average selling price matters more now than it did in the spring, because it is the half that was doing the work.
Inflation is still running above target
Canada’s consumer price index rose 3.1% in the year to September 2026, which is the most recent reading Statistics Canada has published. The October figure is due on November 16, 2026.
Furthermore that sits above the 2% midpoint the Bank aims at. So the pressure behind October’s increase has not gone away, and nobody should plan a purchase on the assumption that rates fall soon.
In plain terms, a quarter point is small on its own. Yet it arrives on top of a price floor that is firming, and the two together decide what a household pays each month. Hence the arithmetic a buyer ran in June no longer holds.
Supply cleared faster than it did a month earlier
Then there is the balance between the two sides, which is what sets prices over time rather than the sales count alone.
Nearly 40% of new listings sold
Divide sales by new listings and October absorbed 39.5% of them, against 30.5% in September and about 37.8% in October 2025 (all calculated). That is a nine-point jump in a single month.
Besides, the yearly comparison shows the same thing from another angle. About 480 fewer homes sold than in October 2025, yet about 1,910 fewer came to market, roughly four times as large a withdrawal (calculated).
What that could do to the average selling price
Sellers read conditions the way buyers do. Hence many chose not to list in October 2026, and a thin market is how competition returns later.
Ultimately that is the link back to the average selling price. Supply leaving faster than demand is exactly the condition under which a shrinking discount keeps shrinking.
That said, TRREB did not publish an active-listing count or a months-of-inventory figure on either release page, so this post does not quote one. The ratio above is the measure that can be checked.
John DiMichele, the board’s chief executive, pointed past the month entirely. Short-term swings aside, he said in the same release, “the permanent population will continue to grow in our region”, which is the slow force behind housing demand here.
Similarly, board president Daniel Steinfeld tied the outlook to events well outside the housing file. Clearer economic news could “renew interest in homeownership as we move into 2027”, he said, naming trade talks among the reasons.
How to use the average selling price in a decision
Ultimately a monthly report earns its keep only if it changes what you do. So here is what October’s average selling price should change, on each side of the table.
If you are buying
- Price the index, not the average. A comparable home is worth about 4.3% less than a year ago. That is the number to negotiate from.
- Run the payment at 2.50%, not at a 2025 rate. Test it through my payment calculator at the price you can actually close on.
- Treat the discount as shrinking, not gone. About $28,400 of yearly gap remains on the regional figure. In September it was nearly double that.
- Decide on your own timetable. Waiting for cheaper money is a bet, and December 9 is a rate date, not a promise.
If you are selling
- Count your competition. New listings fell 11.9% in a year, so your home faces fewer rivals than it would have in October 2025.
- Price to October, not to spring. My home valuation page sets a realistic number against current comparable sales.
- Weigh autumn against spring honestly. Spring brings more buyers and also more sellers. Neither season wins automatically.
Want the whole sequence in writing? For instance, my step-by-step guide for buyers runs from pre-approval to keys, and the monthly market updates track every figure above as it changes.
Your average selling price questions
Short answers to what buyers and sellers are asking me about the October 2026 report.
Is the average selling price still falling?
Yes, but far more slowly. The average selling price was 2.7% below October 2025, against a 5.1% yearly drop in September. Month over month it rose about 1.8% (calculated).
Is this average selling price realistic for Mississauga?
Not on its own. It is the regional figure across every home type, so it overstates a condo and understates a detached house. Ask for comparable sales in the area and type you are shopping.
Why did the Bank of Canada raise rates in October?
Inflation. Canada’s consumer price index rose 3.1% in the year to September 2026, above the 2% midpoint the Bank aims at. It lifted the policy rate to 2.50% on October 28, 2026.
Should I wait for the December rate decision?
The next announcement lands on December 9, 2026. Waiting five weeks costs little, although the price cushion has been shrinking faster than rates have moved.
What does 39.5% of new listings sold mean?
Simply, it is sales divided by new listings for the month (calculated). A higher share means supply is clearing faster, which usually firms up prices rather than softening them.
Sources and further reading
- TRREB – October 2026 — the month
- TRREB – September 2026 — the comparison
- Bank of Canada – rate — 2.50%
- Bank of Canada – dates — Dec 9
- Statistics Canada – CPI — 3.1%
Keep reading on the blog
More market analysis and guides from this blog.
- GTA Home Sales, September 2026 — the month before
- The Interest Rate Hike and GTA Mortgages — October 28
- GTA Mortgage Renewal in 2027 — renewals
- Days on Market in the GTA — timing
Ready to test these numbers against your own move?
Send me the area and price range you are watching and I will put October’s figures beside the comparable sales that actually apply to it, buying or selling. No pressure, and no obligation.
Prefer to start with a number? Get a tailored home valuation or run the figures in the mortgage calculator.
Disclaimer: This article draws on TRREB’s October and September 2026 market release pages, on the Bank of Canada and on Statistics Canada. It offers information only. I calculated the share of new listings sold, the implied October 2025 figures, both dollar gaps and the month-over-month change. TRREB published no active-listing or months-of-inventory figure on either release page. Market figures move monthly, so confirm the current ones before you act. Nothing here is financial, mortgage, tax or legal advice. A. Q. Mufti – Sales Representative, RE/MAX Real Estate Centre Inc., Brokerage.
A. Q. Mufti — Sales Representative
RE/MAX Real Estate Centre Inc., Brokerage
MSc, PMP®, ABR®, SRS®, CNE®
416 908 5600 · 905 270 2000
info@aqmuftirealty.com
141-1140 Burnhamthorpe Rd. W., Mississauga ON L5C 4E9
Serving Mississauga, Oakville, Milton, Brampton, Toronto and the wider GTHA. More about how I work.