
GTA Housing Market Report – June 2026 – Time To Act Now
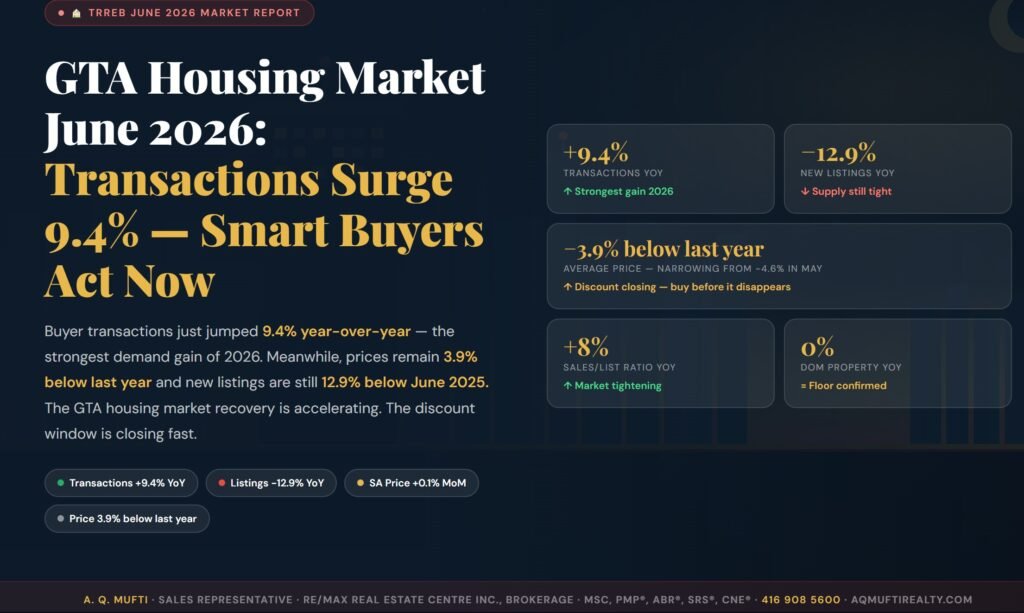
+9.4% 🏠 TRREB June 2026 Market Report GTA Housing Market June 2026:Transactions Surge 9.4% — Smart Buyers Act Now GTA Housing Market Report – June 2026 shows Buyer transactions just jumped 9.4% year-over-year — the strongest demand gain of 2026. Meanwhile, prices remain 3.9% below last year and new listings are still 12.9% below June 2025. The GTA housing market recovery is accelerating. The discount window is closing fast. Transactions +9.4% YoY Listings −12.9% YoY SA Price +0.1% MoM Price 3.9% below last year +9.4% Transactions YoY ↑ Strongest gain 2026 −12.9% New Listings YoY ↓ Supply still tight −3.9% below last year Average price — narrowing from −4.6% in May ↑ Discount closing — buy before it disappears +8% Sales/List Ratio YoY ↑ Market tightening 0% DOM Property YoY = Floor confirmed A. Q. Mufti · Sales Representative · RE/MAX Real Estate Centre Inc., Brokerage · MSc, PMP®, ABR®, SRS®, CNE® · 416 908 5600 · aqmuftirealty.com The GTA housing market in June 2026 delivered its most powerful demand signal of the entire recovery cycle. Buyer transactions surged 9.4% year-over-year — accelerating sharply from the 6.3% gain recorded in May. Furthermore, the GTA housing market price discount is actively narrowing: from −4.6% year-over-year in May to −3.9% in June. The recovery is not approaching — it is already here. Moreover, the GTA housing market continues to face a supply constraint that is simply not resolving. New listings remain 12.9% below last year — and the sales-to-new-listings ratio rose 8% year-over-year. Consequently, the fundamental supply-demand imbalance driving GTA housing market price recovery is intensifying, not easing. Additionally, days on market for properties is now flat year-over-year, confirming the correction period is definitively over. What This Report Covers: Your Complete June 2026 GTA Housing Market Breakdown Below, I break down every KPI from the TRREB June 2026 Quick Market Overview — residential, commercial, condo, and rental — with clear, actionable guidance for GTA housing market buyers and sellers. Additionally, each section includes a direct month-over-month comparison to May 2026 so you can see the direction of momentum, not just the snapshot. 📅 Published: July 7, 2026 · ✍️ A. Q. Mufti, Sales Representative · RE/MAX Real Estate Centre Inc., Brokerage · 📍 Mississauga, GTA · ⏱ 9 min read Watch: June 2026 GTA Housing Market Update Prefer to watch? This 2-minute video covers the three biggest June 2026 GTA housing market signals and what they mean for your next move. TRREB JUNE 2026 · A. Q. MUFTI +9.4% TRANSACTIONS YOY -12.9% NEW LISTINGS YOY -3.9% AVG PRICE YOY +8% SALES/LIST RATIO 0% DOM — FLAT (FLOOR) GTA Housing Market Update — June 2026 A. Q. Mufti · RE/MAX Real Estate Centre Inc. · 2 min 30 sec ℹ To activate: record a 2–3 min walkthrough of the data below and paste your YouTube or Vimeo embed code where the play button sits above. 📊 Residential Market Snapshot June 2026 GTA Housing Market: Eight Numbers That Define the Recovery Each metric drawn directly from the TRREB June 2026 Quick Market Overview — compared to May 2026 to show the momentum. Transactions YoY +9.4% ↑ Accelerating ↑ from +6.3% in May Strongest year-over-year gain of 2026. GTA housing market demand is accelerating, not plateauing. SA Transactions MoM +1.4% ↑ Sustained growth A fourth consecutive month of SA transaction gains. The trend is structural, not seasonal. Average Price YoY −3.9% ↓ Narrowing discount Was −4.6% in May Discount is closing. Each month of delay costs buyers more. Act before it reaches zero. SA Price MoM +0.1% ↑ 4th month rising Four consecutive months of SA price gains — the longest recovery streak of this cycle. New Listings YoY −12.9% ↓ Supply constrained Easing from −18.9% May Supply recovering slightly but still far below last year. Demand exceeds available homes. Sales/List Ratio YoY +8% ↑ Tightest of 2026 ↑ from +6% in May More sales relative to listings than any prior month this year. Classic pre-price-surge pattern. DOM — Property YoY 0% = Floor confirmed ↓ from +7.7% in May Days on market is now flat year-over-year. The correction period is definitively over. DOM — Listing YoY +11.5% Watch this space Listings slightly extended vs last year — but the property DOM signal of 0% is the more meaningful indicator. “Transactions accelerated to +9.4% YoY in June while the price discount narrowed to −3.9%. The GTA housing market sales-to-new-listings ratio hit +8% — the tightest of 2026. Days on market is now flat. Every indicator is pointing the same direction: prices are going up. The only question is whether you act before or after they do.” June 2026 GTA Housing Market — Full Data at a Glance The infographic below summarizes all key June 2026 TRREB metrics. Furthermore, it shows the month-over-month improvement from May — confirming the GTA housing market recovery is gaining momentum, not stalling. GTA HOUSING MARKET · JUNE 2026 · TRREB MARKET DATA Analysis by A. Q. Mufti · RE/MAX Real Estate Centre Inc., Brokerage · aqmuftirealty.com · 416 908 5600 Transactions YoY +9.4% ↑ was +6.3% Sales/List Ratio YoY +8% ↑ was +6% SA Transactions MoM +1.4% SA Price MoM +0.1% Avg Price YoY −3.9% ↑ was −4.6% New Listings YoY −12.9% ↑ was −18.9% DOM Property YoY 0% FLAT ✓ Condo Price QoQ −9.1% Condo Rentals QoQ +10.6% 5 KEY SIGNALS 1 Demand accelerating +9.4%Strongest gain of 2026 2 Price discount closing−3.9% vs −4.6% in May 3 DOM flat — floor confirmed0% YoY — correction over 4 4 months SA price gainsLongest streak this cycle 5 Condos deepest discount−9.1% price · +10.6% rentals JUNE vs MAY 2026 — THE MOMENTUM Transactions: +6.3% → +9.4% ↑ Sales Ratio: +6% → +8% ↑ Price Gap: −4.6% → −3.9% ↑ accelerating tightening closing fast Source: TRREB Quick Market Overview June 2026 · A. Q. Mufti · RE/MAX Real Estate Centre Inc. · 416 908 5600 · aqmuftirealty.com Figure 1: TRREB June 2026 GTA housing market data summary with May 2026 comparison
GTA Real Estate May 2026: 5 Reasons Buyers Must Act Now
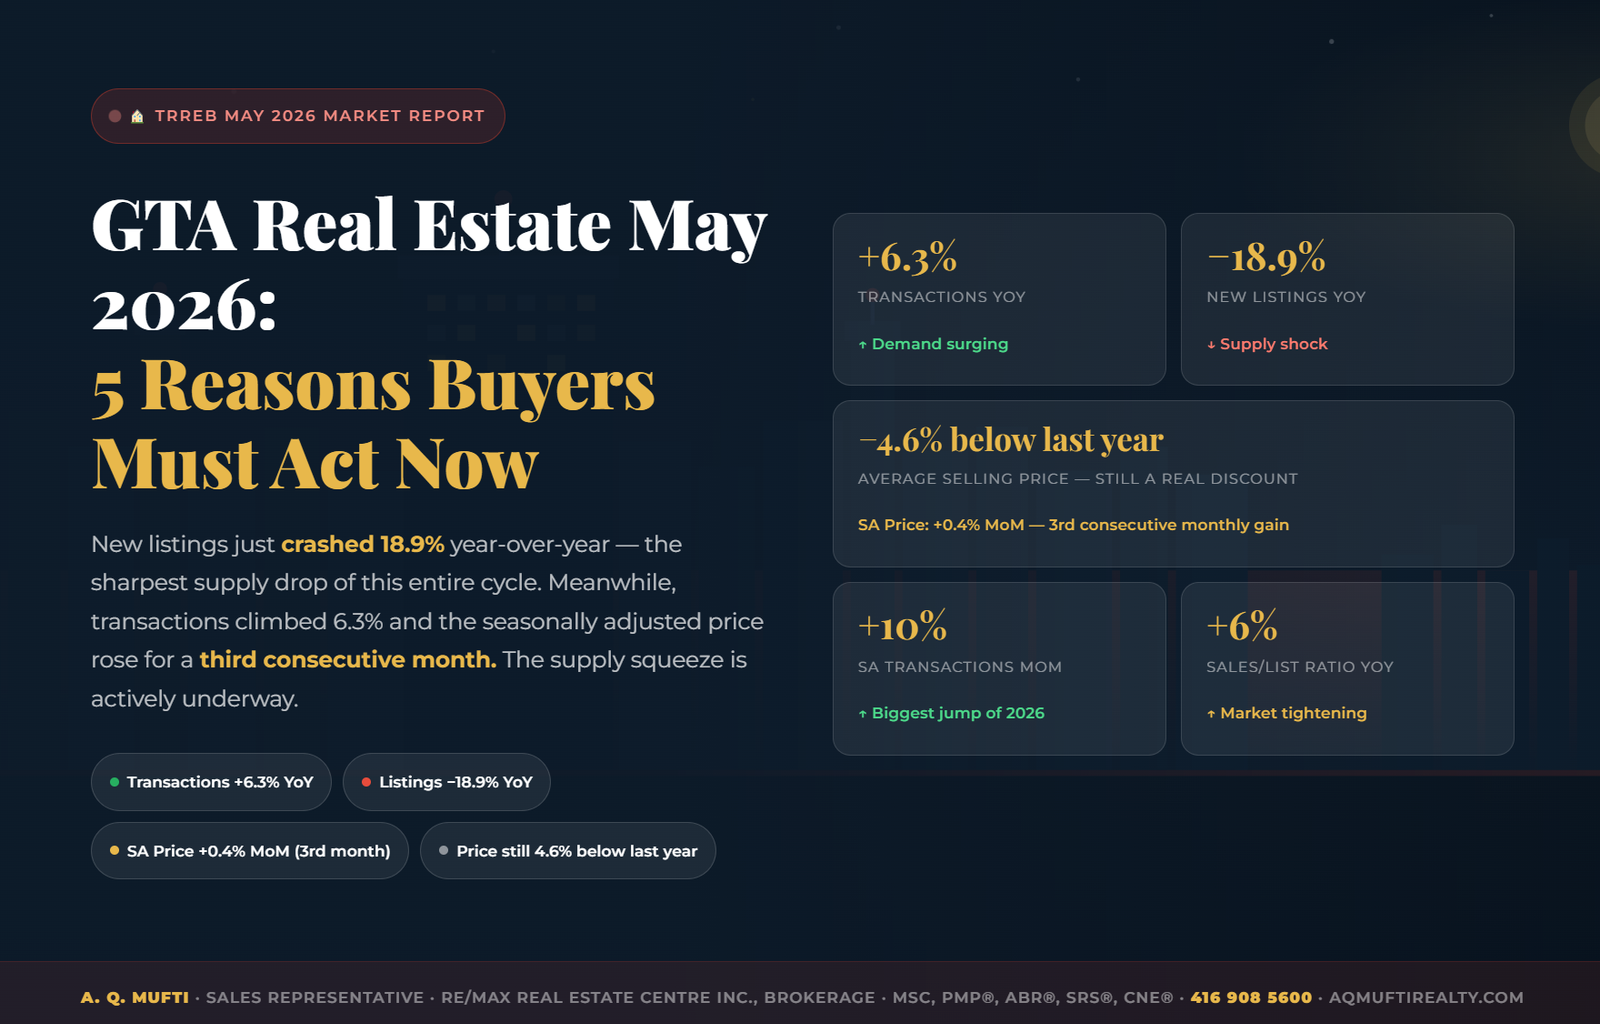
🏠 TRREB May 2026 Market Report GTA Real Estate May 2026:5 Reasons Buyers Must Act Now New listings just crashed 18.9% year-over-year — the sharpest supply drop of this entire cycle. Transactions climbed 6.3% and the seasonally adjusted price rose for a third consecutive month. The supply squeeze is actively underway. Transactions +6.3% YoY Listings −18.9% YoY SA Price +0.4% MoM · 3rd month Price still 4.6% below last year +6.3% Transactions YoY ↑ Demand surging −18.9% New Listings YoY ↓ Supply shock −4.6% below last year Average selling price — still a real discount SA Price +0.4% MoM — 3rd consecutive monthly gain +10% SA Transactions MoM ↑ Biggest jump 2026 +6% Sales/List Ratio YoY ↑ Market tightening A. Q. Mufti · Sales Representative · RE/MAX Real Estate Centre Inc., Brokerage · MSc, PMP®, ABR®, SRS®, CNE® · 416 908 5600 · aqmuftirealty.com Frankly, the May 2026 TRREB data is the most decisive buying signal of this entire market cycle. New listings plunged 18.9% year-over-year — a staggering supply collapse. Moreover, transactions simultaneously rose 6.3%. The result is a textbook supply squeeze: more buyers competing for dramatically fewer homes. Furthermore, the seasonally adjusted price has now increased for three straight months. That is not coincidence — it is confirmation. Additionally, the seasonally adjusted transaction count surged 10% from April to May alone, the strongest single-month demand gain of 2026. Consequently, buyers who have been waiting for the right signal now have three of them at once. Below, I break down every KPI from the May 2026 TRREB Quick Market Overview — residential, commercial, condo, and rental — and translate each one into clear, actionable insight. 📅 Published: June 4, 2026 · ✍️ A. Q. Mufti, Sales Representative · RE/MAX Real Estate Centre Inc., Brokerage · 📍 Mississauga, GTA · ⏱ 9 min read 📊 Residential Market Snapshot May 2026: Eight Numbers That Tell the Whole Story Each metric drawn directly from the TRREB May 2026 Quick Market Overview. Transactions YoY +6.3% ↑ Demand confirmedMore buyers in May 2026 than May 2025. Demand recovery is real. SA Transactions MoM +10% ↑ Biggest 2026 jumpStrongest single-month demand surge of the entire year. Average Price YoY −4.6% ↓ Buy at a discountStill meaningfully below last year — a shrinking window before full recovery. SA Price MoM +0.4% ↑ 3rd month risingThree consecutive SA monthly gains. The floor is statistically confirmed. New Listings YoY −18.9% ↓ Supply shockSharpest listing decline of this cycle — fewer homes as more buyers compete. Sales/List Ratio YoY +6% ↑ Market tighteningSales rising relative to listings — the classic pre-acceleration pattern. DOM — Property YoY +7.7% Slightly extendedModestly longer than May 2025 — compressing month-over-month as demand rises. DOM — Listing YoY +8% Similar patternExtended vs last year, but well-priced Mississauga homes sell significantly faster. “New listings collapsed 18.9%. Transactions rose 6.3%. The SA price gained for a third straight month. In three decades of GTA market cycles, this precise combination has consistently preceded rapid price acceleration — without a single exception.” May 2026 GTA Market — Full Data at a Glance The infographic below summarizes every key May 2026 TRREB metric. Furthermore, it highlights the five critical action signals buyers should act on immediately. GTA REAL ESTATE · MAY 2026 · TRREB MARKET DATA Analysis by A. Q. Mufti · RE/MAX Real Estate Centre Inc., Brokerage · aqmuftirealty.com · 416 908 5600 SA Transactions MoM +10.0% Transactions YoY +6.3% Sales/List Ratio YoY +6% SA Price MoM +0.4% Avg Price YoY −4.6% New Listings YoY −18.9% Condo Price QoQ −9.1% Condo Rentals QoQ +10.6% 5 ACTION SIGNALS 1 Supply shock — listings −18.9%Sharpest drop of this cycle 2 Demand spike — +10% SA MoMStrongest demand of 2026 3 Price floor confirmed — 3 monthsSA price rising consecutively 4 Condos at deep discount −9.1%Best value in GTA right now 5 Commercial expanding fast+18.6% office, +18.3% retail Source: TRREB Quick Market Overview May 2026 · A. Q. Mufti · RE/MAX Real Estate Centre Inc. · 416 908 5600 · aqmuftirealty.com Figure 1: TRREB May 2026 full market data — A. Q. Mufti, RE/MAX Real Estate Centre Inc., Brokerage · Mississauga, ON 📈 Charts Month-over-Month Momentum — Visualized Residential — Year-over-Year % Change · May 2026 vs May 2025 Source: TRREB Quick Market Overview · May 2026 SA Transactions MoM +10.0% Transactions YoY +6.3% Sales/List Ratio YoY +6% SA Price MoM +0.4% Days on Market +7.7% YoY Avg Price YoY −4.6% (discounted) New Listings YoY −18.9% (supply shock!) Supply vs. Demand — The Gap Is Widening Fewer listings + more transactions = price pressure building now MAY 2026 SupplyDemand 2023Q2 2024Early 2025Late 2025May 2026Projected Buyer demand New listings supply Projected price recovery 🔍 Analysis Six Critical Signals Decoded — in Plain English 🚨 The Supply Shock Is Historic An 18.9% year-over-year listing decline exceeds any single-month supply drop in recent GTA history. Consequently, buyers face fewer choices and less negotiating power every week. Therefore, the pricing advantage available today is rapidly diminishing. ⚡ Demand Surged 10% in One Month The seasonally adjusted 10% month-over-month transaction jump is the strongest demand signal of 2026. Moreover, it confirms the 6.3% year-over-year gain is structural — not seasonal. As a result, buyers are returning faster than any projection anticipated. 💰 Three Months of SA Price Gains Three consecutive months of rising seasonally adjusted prices represent a statistically meaningful trend. Furthermore, the TRREB Home Price Index confirms the same direction. Therefore, buyers who waited “one more month” have already paid the cost of that hesitation. ⏱️ Days on Market — Use the Time Now Properties take 7.7% longer to sell than May 2025 — however, this advantage is neighbourhood-specific and shrinking. Nevertheless, in well-located Mississauga areas, well-priced homes are moving significantly faster than the GTA average. 🏢 Condos — Deepest Discount Available Condo prices fell 9.1% QoQ — the most discounted asset in the entire GTA right now. Additionally, new condo listings dropped 19.4% QoQ while rental demand rose 10.6%. Therefore, investors who enter
GTA Real Estate April 2026: — Why Buyers Must Act Now

GTA Real Estate Market Report April 2026: Transactions Up 7% — Why Buyers Must Act Now | A. Q. Mufti, RE/MAX f 𝕏 in W 🏠 TRREB Quick Market Overview · April 2026 GTA Transactions Up 7% Year-Over-Year — The Recovery Has Quietly Begun Prices remain 4.9% below last year. New listings just dropped 9.3%. Buyers are flooding back while supply shrinks. The data is sending a clear message — and it won’t stay this way for long. +7%Transactions YoY −4.9%Avg Price YoY −9.3%New Listings YoY +16%Days on Mkt YoY +0.8%Price MoM (SA) A. Q. Mufti · Sales Representative · RE/MAX Real Estate Centre Inc. · 416 908 5600 In real estate, the loudest signal is rarely the most important one. While the headlines focus on prices still being below last year, the April 2026 TRREB data is quietly telling a very different story: buyers are returning faster than sellers can list, and the seasonally adjusted price has now risen two consecutive months. We have seen this movie before — and we know how it ends. Below is my full breakdown of the April 2026 TRREB Quick Market Overview — covering residential, commercial, condominium sales, and rental markets — with plain-language guidance for buyers, sellers, and investors. 📅 Published: May 5, 2026 · ✍️ A. Q. Mufti, Sales Representative · RE/MAX Real Estate Centre Inc. · 📍 Mississauga, GTA · ⏱ 9 min read 📊 Residential Market Snapshot April 2026 Key Performance Indicators Eight metrics that define where the GTA market stands — and where momentum is building. Total Transactions YoY +7% ↑ More buyers active Year-over-year — demand is clearly re-entering the market. Transactions (Seasonally Adj.) +6.1% ↑ vs prior month Adjusting for seasonality confirms the trend is real, not just spring. Average Selling Price YoY −4.9% ↓ Discount vs last yr Prices still below 2025 — the window to buy at a discount is open. Avg Price (Seasonally Adj.) +0.8% ↑ 2nd consecutive rise Month-over-month price recovery underway. Floor may be confirmed. New Listings YoY −9.3% ↓ Supply shrinking Fewer listings coming to market while demand surges — price pressure building. Sales-to-New Listings Ratio +6% ↑ YoY market tightening More sales relative to listings = less choice = upward price pressure. Days on Market (Property) +16.2% ↑ YoY — still elevated More time to decide — but MoM compression signals this window is closing. Days on Market (Listing) +16% ↑ YoY vs last year Listings sit longer year-over-year — but seasonal data shows absorption speeding up. “Transactions up 7%. Listings down 9.3%. Price recovering month-over-month for the second straight month. The GTA market is not stagnant — it is actively repricing toward recovery.” 📈 Visual Analysis The Numbers in Context Residential Market — Year-over-Year % Change April 2026 vs. April 2025 · Source: TRREB Quick Market Overview Total Transactions +7% YoY S/A Transactions +6.1% MoM Sales-to-List Ratio +6% YoY New Listings −9.3% YoY Avg Price (YoY) −4.9% YoY Days on Mkt +16.2% YoY Supply vs. Demand — The Widening Gap Transactions rising while listings fall = classic pre-recovery signal Low High APR 2026 2023 Q1 ’24 Q3 ’24 2025 Apr ’26 Projected Transactions (demand) New Listings (supply) Projected recovery 🔍 What the Data Means for YOU Six Market Signals Decoded 📈 Demand Has Decisively Returned A 7% year-over-year jump in transactions is not noise — it’s a trend. And the seasonally adjusted 6.1% month-over-month gain confirms it’s not just a spring blip. Buyers are back, and they’re competing for fewer listings. 📉 Supply Is Quietly Disappearing New listings fell 9.3% year-over-year. More buyers + fewer homes = upward price pressure. The sales-to-new-listings ratio is already up 6% year-over-year. This is the math that precedes price acceleration. 💰 Price Recovery Has Started — Quietly The seasonally adjusted average price rose 0.8% from March to April. This is the second consecutive monthly gain. While the headline YoY figure still shows −4.9%, the direction of travel has reversed. You’re buying at a discount that is actively shrinking. ⏱️ Days on Market: Your Window Is Shrinking Yes, properties are taking longer than last year to sell (+16.2% YoY). But with the S/A transactions surging 6.1% in one month, absorption is accelerating. The longer YoY DOM reflects the correction period — not the current trajectory. 🏢 Condos: The Deepest Discount in the Market Condo sales dropped 15% QoQ and prices fell 5.1% QoQ. For investors and first-time buyers, this represents the most deeply discounted asset class in the GTA — in a market that is now clearly recovering. Buy low, benefit from the turn. 🏘️ Commercial Activity Points to Economic Confidence Leasing activity surged 12.4% and commercial retail space activity rose 18.3% quarter-over-quarter. When businesses expand, employees follow — and employees need housing. Commercial health is a leading indicator for residential demand. 📋 Full Comparison Residential Market: Apr 2026 vs Prior Periods Metric April 2026 YoY Change MoM Change (S/A) Buyer Signal Total Transactions ↑ Above Apr 2025 ↑ +7% YoY ↑ +6.1% MoM Demand is real & growing Average Selling Price Below Apr 2025 ↓ −4.9% YoY ↑ +0.8% MoM Buy at discount — recovering New Listings Below Apr 2025 ↓ −9.3% YoY — Supply shrinking fast Sales-to-New Listings Higher ratio ↑ +6% YoY — Market tightening Days on Market (Property) Extended ↑ +16.2% YoY — Still time — but closing Days on Market (Listing) Extended ↑ +16% YoY — Negotiate — but act 🧭 Market Pulse Where Is the Needle — April 2026? Buyer vs. Seller Market Conditions BUYER’S SELLER’S BALANCED Leaning Seller S/A ratio up 6% YoY. Demand outpacing supply — shifting toward seller conditions. Transaction Growth Momentum +7% transactions YoY +6.1% month-over-month (S/A) Two consecutive months of rising SA transactions — the trend is confirmed, not coincidental. 🏢 Condo Market · April 2026 Condos: Maximum Discount, Maximum Opportunity The condominium sales market is showing the deepest discounts in the entire GTA real estate spectrum this quarter. For first-time buyers and investors, this is the highest-value entry point in
BOC Rate Cut Unleashes Prime GTA Real Estate Opportunity!

October 29, 2025 By A. Q. Mufti, The Best Realtor in Mississauga, Oakville, Milton, and the GTA The GTA Real Estate Rate Cut is here. Find out how A. Q. Mufti can help you maximize your buying power in Mississauga & Oakville. The Bank of Canada (BOC) just delivered some truly exciting news: a decisive rate cut. As your dedicated Realtor across Mississauga, Oakville, Milton, and the entire GTA, I’m here to tell you exactly why this shift is the opportunity you’ve been waiting for, whether you’re looking to purchase your dream home or make a smart investment. The Immediate Impact of the GTA Real Estate Rate Cut Today’s historic rate adjustment marks a pivotal moment, and its effect on the housing market is both immediate and profound. The primary link is the cost of borrowing: Seize the Opportunity: Your Next Steps This rate cut is the official signal that the market momentum is shifting. Now is the time to act—but you need expert guidance to navigate this change effectively. I am here to advise you. 1. For Homebuyers: Finding Your Dream Home This change puts buying a home within easier reach. The rate reduction increases your purchasing power. 2. For Investors: Making Smart Moves in the GTA Real estate remains a phenomenal long-term investment, and this rate cut makes borrowing capital cheaper, boosting your return on investment (ROI). Why Choose A. Q. Mufti? I’m not just a realtor; I am your dedicated advisor and partner in the GTA real estate market. My deep expertise in Mississauga, Oakville, and Milton ensures that you receive: The opportunity is knocking. Don’t let this rate cut be a missed moment. Let’s discuss your strategy today and turn this financial advantage into the key to your next home or successful investment. Contact A. Q. Mufti today! If you found this review helpful, I would greatly appreciate it if you could kindly leave a Google Review for my real estate services: A. Q. Mufti Google Review Thank you for your continued support! A. Q. Mufti Your trusted Realtor in Mississauga, Oakville, Milton, and the GTA. Phone: 416-908-5600 Email: info@aqmuftirealty.com Meet A. Q. Mufti, Your GTA Realtor: https://www.aqmuftirealty.com/about-aq-mufti Read the Official Bank of Canada Statement: https://www.bankofcanada.ca/2025/10/fad-press-release-2025-10-29/ For more news and articles like this, go to https://aqmuftirealty.com/mississauga-real-estate-market-trends-investment-insights/
2025 Budget: A Transformative Leap for Mississauga Families
As the best Realtor in Mississauga, Oakville, Milton, and the GTA, I, AQ Mufti, Sales Representative, don’t just follow housing data — I study the pulse of policy.Because behind every mortgage payment, renovation, or investment lies a deeper story: one of security, resilience, and human aspiration. The newly unveiled Carney Government Budget 2025 marks a transformative shift for Canadian families.It’s bold, empathetic, and — most importantly — focused on real relief.Here’s how these historic measures will shape our lives, our homes, and the financial heartbeat of Mississauga. 1 – CRA Automatic Tax Filing: The Dawn of Effortless Access The launch of CRA’s automatic tax filing system is not just administrative convenience — it’s an act of financial empowerment.Millions of Canadians who once fell through bureaucratic cracks will now be seen, supported, and strengthened. Why This Is a Game-Changer for Homeowners 2 – The National School Food Program: Compassion with Consequence 🍎 The now permanent National School Food Program brings both emotional relief and measurable financial value.Feeding over 400,000 children nationwide, it reflects Canada’s unwavering commitment to nurturing hearts as well as minds. The Homeowner’s Perspective 3 – Canada Strong: Reigniting Pride and Shared Purpose 🇨🇦 The return of the Canada Strong Pass is more than a perk — it’s a cultural revival.With discounted access to parks, museums, and heritage sites, this initiative restores connection, optimism, and belonging. Impact on the Real Estate Landscape The Bigger Picture: A Secure Future for Mississauga These reforms don’t just manage costs — they rekindle confidence, rebuild stability, and unlock momentum in local markets.Every dollar saved in household expenses creates purchasing power, liquidity, and hope — the real forces behind sustainable growth. For buyers, this means renewed opportunity.For sellers, it signals stronger demand.And for the community, it represents a collective stride toward balance, dignity, and shared prosperity. Act Strategically. Move Confidently. Live Fully. The Carney Budget 2025 is more than an economic plan — it’s a roadmap to resilience.As your trusted Mississauga Realtor, I’m here to translate these changes into an actionable real estate strategy. Whether you’re upgrading, downsizing, or investing, this is the time to align your goals with a market that’s regaining strength. 👉 Start your strategic journey today. Let’s turn these national breakthroughs into your personal success story. As your trusted Mississauga Realtor, I view this budget as a powerful signal of enduring opportunity.Whether you’re planning to buy, sell, or invest, understanding these economic shifts can elevate your financial strategy and protect your future. 👉 Let’s connect to map your next move—strategically, confidently, and successfully. Start Your Strategic Real Estate Journey Today! Your Feedback Builds Our Community If this insight brought clarity or confidence, I’d be grateful for your feedback.Please share your experience in a Google Review for A. Q. Mufti. Thank you for your continued trust and engagement. A. Q. Mufti Your trusted and best Realtor in Mississauga, Oakville, Milton, and the GTA. For more news and articles like this, go to https://aqmuftirealty.com/mississauga-real-estate-market-trends-investment-insights/