
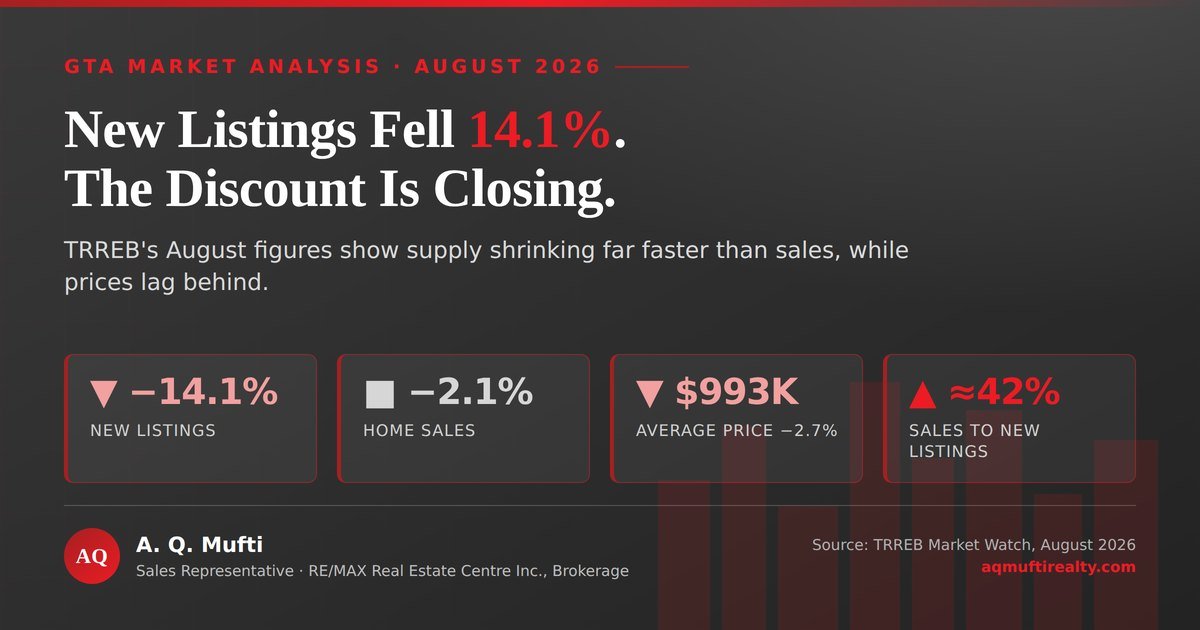
The headline on GTA home prices for August 2026 looks soft. The average selling price was $993,410, which is 2.7% lower than a year ago. But the number that matters more moved the other way. New listings fell 14.1%, while sales dipped only 2.1%. So buyers had far fewer homes to choose from, and that is how price floors form.
In fact, TRREB’s own release framed the dip in sales and listings as pointing to renewed price growth. That is a notable signal from the board. This post walks through the August figures, adds the Bank of Canada’s September hold and the latest inflation print, and then sets out what to do this fall.
The short version
- Prices are down, supply is down more. GTA home prices fell 2.7% year over year on average. New listings fell 14.1%.
- The market is tightening. Sales absorbed about 42% of new listings in August, up from about 37% a year earlier (calculated).
- Rates are on hold. The Bank of Canada kept its policy rate at 2.25% on 2 September. The next decision is 28 October.
- Inflation is sticky. CPI rose 3.0% in August, so a quick cut looks unlikely.
- Mississauga is cheaper than the GTA average. Its average price was $898,510, about $94,900 below the regional figure (calculated).
GTA home prices in August 2026: the numbers
Here is what the Toronto Regional Real Estate Board reported for August, with last year’s levels backed out of its percentage changes.
| Measure | August 2026 | August 2025 | Change |
|---|---|---|---|
| Home sales | 5,057 | ≈5,165 | −2.1% |
| New listings | 12,075 | ≈14,057 | −14.1% |
| Average selling price | $993,410 | ≈$1,020,976 | −2.7% |
| MLS® HPI Composite benchmark | — | — | −4.5% |
| Sales-to-new-listings ratio | ≈41.9% | ≈36.7% | +5.2 points |
| Detached average price | $1,288,669 | — | — |
| Condo apartment average price | $617,593 | — | — |
| City of Mississauga average price | $898,510 | — | — |
The number that changed direction for GTA home prices
Price is a lagging measure. It tells you what closed weeks ago. Supply and demand tell you what happens next, and the cleanest gauge of that balance is the sales-to-new-listings ratio.
To get it, divide the month’s sales by the month’s new listings. Below about 40%, sellers compete for buyers. Above about 60%, buyers compete for homes. Between the two, the market is balanced.
In August 2025 that ratio sat near 36.7%, which is buyer’s territory. This August it reached about 41.9% (both calculated from TRREB’s figures). So the region has moved into balance, even though the price data still shows a decline. That gap between the two is the opportunity, and it will not last forever. It is also the clearest early signal for where GTA home prices go next.
If inventory tightens and home prices begin to rise, some buyers may face a trade-off between waiting for greater economic certainty and purchasing before prices move higher.
Daniel Steinfeld, President, Toronto Regional Real Estate Board
Why sellers are holding back
My read is that many owners who listed in 2025 did not get the price they wanted. Rather than cut again, they pulled the listing and waited. As a result, fresh supply has thinned out month after month. Meanwhile, sales have held fairly steady, because buyers still need homes.
TRREB also noted that, on a seasonally adjusted basis, the benchmark price was essentially flat from July to August, and the average price edged up. In other words, the slide has paused. It has not reversed yet, but it has stopped accelerating.
Rates, inflation and GTA home prices
On 2 September the Bank of Canada held its policy rate at 2.25%, with the Bank Rate at 2.5%. The Bank said GDP grew by 3.3% in the second quarter and unemployment edged down to 6.4% in July. It also noted that CPI inflation has hovered around 3%, mainly because of higher gasoline prices.
Since then, Statistics Canada reported that CPI rose 3.0% in August, the same as July. Excluding gasoline, prices rose 2.4%, up from 2.2%. Rent rose 2.8%, so tenants are not getting relief either.
The Bank’s summary of deliberations points the same way. Governing Council saw elevated upside risks to inflation from energy prices and tariffs. It also noted housing activity rebounded in the second quarter, despite continued softness in Toronto condos.
Put simply, a quick rate cut looks unlikely. Therefore waiting for cheaper money is a weak plan this fall. Instead, waiting mostly buys you more competition, because every month of steady rates brings sidelined buyers back. The next decision lands on 28 October, together with a new Monetary Policy Report.
So if you read GTA home prices as a reason to wait, look again. Borrowing costs have stopped falling. Supply has stopped growing. Only the price data still points backwards.
What GTA home prices mean for buyers this fall
You are shopping in a narrow window. GTA home prices still reflect a soft year. Competition reflects a tightening summer. Those two rarely sit together for long, so the leverage you have now is real, but it is fading.
Property type matters a great deal. The average detached home sold for $1,288,669 in August, while the average condo apartment sold for $617,593. That is a gap of $671,076 (calculated). Also, the Bank flagged ongoing softness in Toronto condos, which is where negotiating room is usually deepest.
Four moves to make while GTA home prices lag
- Get a real pre-approval. Hold the rate for 90 to 120 days, so an October surprise cannot reprice your budget.
- Stress-test one point higher. Run your payment at plus one percentage point in the payment calculator, so a hike is an inconvenience rather than a crisis.
- Write cleaner offers, not just lower ones. With fewer listings, a firm date and a solid deposit often beat another few thousand dollars.
- Set your walk-away number first. Balanced markets punish hesitation and reward preparation.
If this is your first purchase, the order you do things in matters more than any tactic. My step-by-step guide for buyers covers the sequence, and the home finder will alert you when a match appears.
Mississauga compared with GTA home prices
Mississauga recorded 435 sales in August at an average price of $898,510, according to TRREB. The median was $842,000. So the city sits roughly $94,900 below the GTA-wide average (calculated), which keeps it one of the more accessible options for families moving out of Toronto. Locally, the picture matches GTA home prices overall: steady demand and a thinner choice of homes.
That discount matters. On the GTA average, the same budget stretches roughly 10% further in Mississauga (calculated). Moreover, the city has a wide mix of stock, from condos near Square One to detached homes in older neighbourhoods.
In my experience, the best value sits in older townhouse and semi-detached stock, where the price step from a condo is smaller than people expect. Walk a few of those before you decide a detached home is out of reach.
What it means if you are selling
Sellers face less competition than they did a year ago, because new listings are down 14.1%. However, buyers remain price-sensitive, and the benchmark is still down 4.5%. So an ambitious list price will sit, even in a thinner market.
Price to the market as it is now, not to the 2022 peak. Then let the shortage of alternatives do the work. Also, list before the late-fall slowdown rather than waiting for spring, when every seller who held back will list at once.
Start with a current valuation of your home and work back from there. My guide for sellers covers preparation in more detail.
In short, today’s GTA home prices reward whoever moves first. Buyers still have a price advantage. Sellers have a scarcity advantage. Both shrink as the market settles into balance.
Your questions about GTA home prices, answered
Short answers to what buyers and sellers are asking me this month.
Are GTA home prices still falling?
Year over year, yes. GTA home prices were down 2.7% on average, and the benchmark was 4.5% lower than in August 2025. But on a seasonally adjusted basis, TRREB said the benchmark was essentially flat from July, and the average price edged up. The decline has paused.
Is the GTA still a buyer’s market?
Not quite. Sales absorbed about 42% of new listings in August, up from about 37% a year earlier (calculated). Below 40% favours buyers, so the region has moved into balanced territory.
Should I wait for the October rate decision?
Waiting is a weaker plan than it was. The Bank held at 2.25% on 2 September, CPI rose 3.0% in August, and the Bank sees upside risks to inflation. A cut on 28 October is far from certain, while supply keeps tightening.
Which property type offers the most room to negotiate?
Condo apartments, generally. The Bank itself pointed to continued softness in Toronto condos, and the average condo apartment price was $617,593 in August. Detached homes have tightened faster.
When is the next TRREB report?
TRREB usually publishes Market Watch in the first week of the month. The September figures should land in early October, and I will cover them here.
Sources and further reading
- TRREB — August 2026 GTA housing market release — published 3 September 2026
- TRREB — Market Watch, August 2026 (PDF) — property-type and regional tables
- Bank of Canada — policy rate held at 2.25% — 2 September 2026 decision
- Bank of Canada — summary of deliberations — for the 2 September 2026 decision
- Statistics Canada — Consumer Price Index, August 2026 — released 14 September 2026
Keep reading on the blog
More market analysis and practical guides from this blog.
- GTA Real Estate Fall 2026: What Buyers Must Do Now — the July numbers that started this trend
- GTA Housing Market Report – June 2026 — how the early summer set up
- How a Rate Cut Opens a Buying Window — the last time borrowing costs moved
- Ten Essential Steps for First-Time Buyers in Mississauga — start here if this is your first purchase
Ready to talk about your next move?
The August numbers point one way: less choice, steadier prices, and a shorter runway than most buyers assume. Let us look at your budget, your neighbourhood and your timeline together, and decide what makes sense for you. No pressure, and no obligation.
Prefer to start with a number? Get a tailored home valuation or run the figures in the mortgage calculator.
Disclaimer: This analysis draws on TRREB’s Market Watch for August 2026, Bank of Canada publications and Statistics Canada data, and it is provided for information only. It is not financial, mortgage or legal advice, and market conditions change. A. Q. Mufti is a registered Sales Representative with RE/MAX Real Estate Centre Inc., Brokerage, Ontario, Canada.
A. Q. Mufti — Sales Representative
RE/MAX Real Estate Centre Inc., Brokerage
MSc, PMP®, ABR®, SRS®, CNE®
416 908 5600 · 905 270 2000
info@aqmuftirealty.com
141-1140 Burnhamthorpe Rd. W., Mississauga ON L5C 4E9
Serving Mississauga, Oakville, Milton, Brampton, Toronto and the wider GTHA. More about how I work.