The May 2022 sales report from the Toronto Regional Real Estate Board (TRREB) arrived at a key moment. I know you were anxiously waiting to see what was happening in the market after my last analysis. This was especially true after the effects of the BOC rate increase by fifty basis points. So let’s look at the latest numbers TRREB released for May 2022.
This post was first published in June 2022. The figures below are from that time.
Sales and prices in the May 2022 sales report
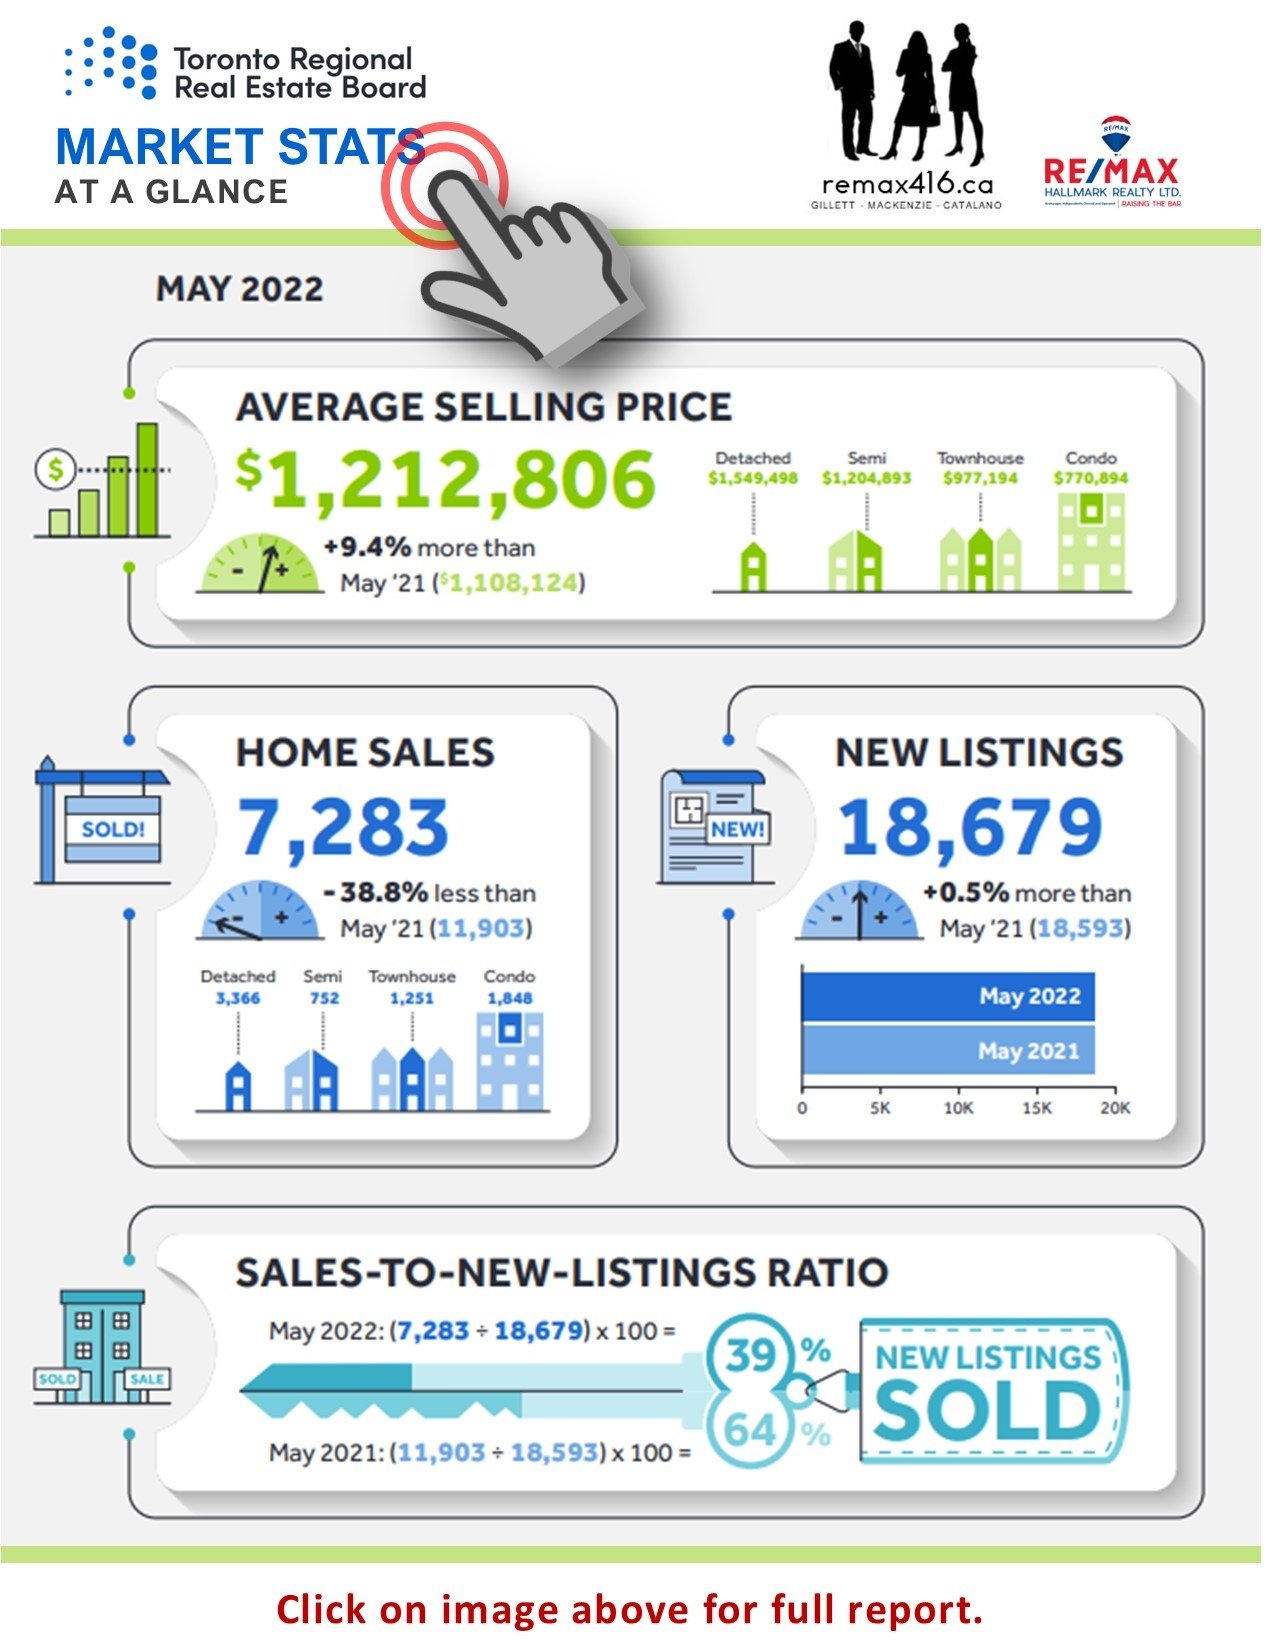
The market continued its downward trend from the previous month. Residential transactions saw a similar negative trend of 39%, close to the 41% seen when compared to the same months last year. Total transactions came to 7.3K, compared to the previous month’s 11.9K.
Seasonally adjusted transactions also saw a 9.3% dip. They recorded 6.2K in May 2022, compared to 6.8K in the same month last year.
As I have been saying all along, the unrealistic price has adjusted itself. Meanwhile, the realistic price has stayed stable or continued to rise. The May 2022 sales report shows this with a positive increase of 9.4% in May this year compared to May 2021. The average selling price in May rose to $1.213M, up from $1.108M recorded in May 2021.
By contrast, the seasonally adjusted average selling price saw a dip of 3.1%. Seasonal adjustment removes the usual spring and fall swings, so it shows the underlying trend more clearly. It went from $1.214M in April 2022 to $1.176M in May 2022.
Listings, sales ratio and days on market
There was a very slight jump in total new listings, an increase of .50%, for a total of 18,679 listings. Even so, fewer new listings sold, with a decline of 25% overall. That brought the sales-to-new-listings ratio to 39% in May 2022, down from 64% in the same month last year.
Properties also stayed on the market much longer than in the same month last year. In the May 2022 sales report, homes took 18 days to sell, compared with 15 days in May 2021. That means it took 20% more days to sell a property.
The Home Price Index (HPI) continued its upward trend and crossed the 1,250K mark. As per the TRREB definition, the HPI provides a price growth measure for a benchmark home with the same characteristics over time. In other words, it allows for an apples-to-apples comparison from one year to the next.
Condo sales and rents in the first quarter
Alongside the May 2022 sales report, TRREB’s first-quarter figures for condos told their own story. Residential condominium sales took a negative hit and recorded a 15.6% decline. Sales fell from 9,399 to 7,932 when comparing Q1 results with the same period last year.
To the surprise of many, the average selling price of condos saw a jump of 22.4%, comparing Q1 2022 with Q1 2021. Total new listings saw a very slight jump of 3% in Q1 of 2022.
The sales-to-new-listings ratio took a dip of 14% compared with the same quarter last year. About 69% of new listings sold in the current quarter, while 83% sold in the same quarter last year. Also, the number of days a listing stayed on the market dropped to 12 days. That was a big reduction of 48% from 23 days in the same period last year.
Rentals tightened too. There were 23% fewer condos rented, and new rental condos on the market fell by 43%. This created a supply and demand squeeze. As a result, rent for a one-bedroom apartment jumped by 18%, to $2,145 in Q1 2022 from $1,820 in Q1 2021.
Commercial and industrial lease rates
The commercial side of the market also shifted in Q1 2022, as TRREB reported alongside the May 2022 sales report. Commercial leasing and sales activities declined by 25.4% and 22% respectively in Q1 2022 compared to Q1 2021. Here is how lease rates moved:
- The average industrial lease rate increased by 29%, to $13.17/SF.
- The average commercial/retail lease rate increased by 14.4%, to $22.74/SF from $19.88/SF.
- The average office lease rate saw a decline of 2%, to $17.73/SF from $18.1/SF.
For small business owners, these numbers matter when a lease comes up for renewal. Industrial space in particular was in high demand. So owners and tenants alike needed to plan well ahead.
Homeowners can learn from this too. Rising lease rates often point to strong demand for space in the region. That demand supports local jobs, which in turn supports the housing market over time.
What the May 2022 sales report means after the rate hike
The Bank of Canada raised its rate by fifty basis points just a day before this post. So we will have to watch the market’s reaction for some time to come. On one side, the change would hurt the affordability of potential buyers. On the other hand, we may see, hopefully, some settling in home prices. Only time will tell.
Here is what these numbers suggested for your plans:
- Buyers had more choice and more time than in 2021, so careful shopping paid off.
- Sellers needed realistic pricing, because days on market were rising.
- Condo investors saw rents rising even as condo sales fell.
Rates have moved a great deal since then, in both directions. So the exact figures here belong to their time. Still, the lesson holds. When borrowing costs change quickly, buyers and sellers both need a plan that works at more than one rate.
If you are buying, get a pre-approval and know your limit before you shop. If you are selling, study recent sales near you rather than last year’s peak. And if you own a rental condo, review your rent and your costs each year so you stay on track.
For the month before, read my look at TRREB’s April 2022 market trends. You can also read about the Bank of Canada’s June 1, 2022 rate increase. Newer reports than the May 2022 sales report are always on TRREB’s website. I will keep you posted, as always, so you can make an informed decision about what is often the largest investment of your life.
Talk to a Mississauga real estate agent
Do you have questions about buying, selling or planning your next move? I am happy to help. You can reach me through my contact page or call me directly at 416 908 5600. A. Q. Mufti, Sales Representative, RE/MAX Real Estate Centre Inc., Brokerage.
Disclaimer: this article was published on 18 January 2025 and reflects the information available at that time. Interest rates, prices, and government programs change, so check the current position before acting on anything here. It is provided for information only and is not financial, mortgage, tax or legal advice. A. Q. Mufti is a registered Sales Representative with RE/MAX Real Estate Centre Inc., Brokerage, Ontario, Canada.