
GTA Housing Market Report – June 2026 – Time To Act Now
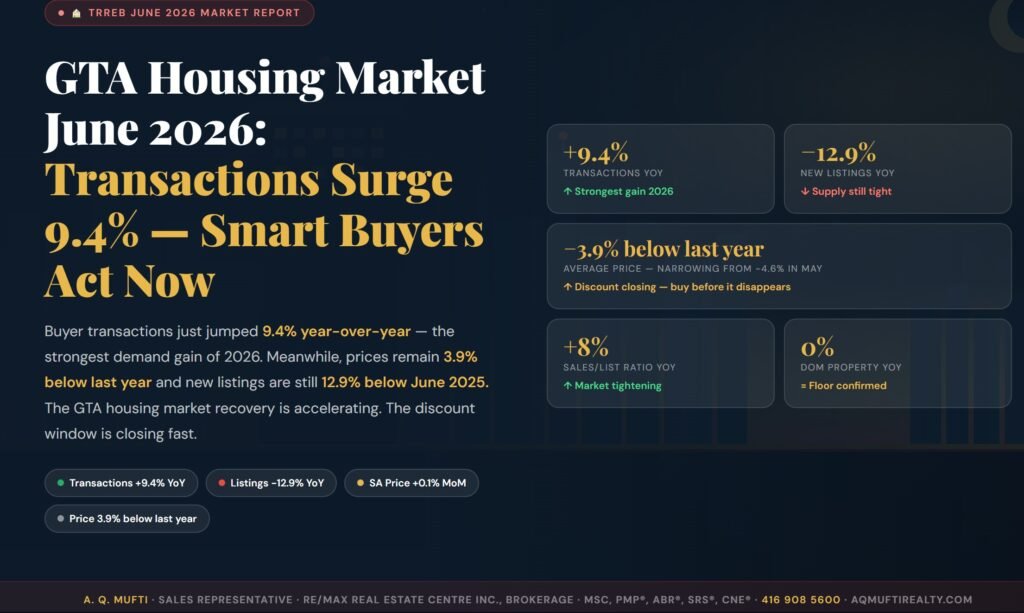
+9.4% 🏠 TRREB June 2026 Market Report GTA Housing Market June 2026:Transactions Surge 9.4% — Smart Buyers Act Now GTA Housing Market Report – June 2026 shows Buyer transactions just jumped 9.4% year-over-year — the strongest demand gain of 2026. Meanwhile, prices remain 3.9% below last year and new listings are still 12.9% below June 2025. The GTA housing market recovery is accelerating. The discount window is closing fast. Transactions +9.4% YoY Listings −12.9% YoY SA Price +0.1% MoM Price 3.9% below last year +9.4% Transactions YoY ↑ Strongest gain 2026 −12.9% New Listings YoY ↓ Supply still tight −3.9% below last year Average price — narrowing from −4.6% in May ↑ Discount closing — buy before it disappears +8% Sales/List Ratio YoY ↑ Market tightening 0% DOM Property YoY = Floor confirmed A. Q. Mufti · Sales Representative · RE/MAX Real Estate Centre Inc., Brokerage · MSc, PMP®, ABR®, SRS®, CNE® · 416 908 5600 · aqmuftirealty.com The GTA housing market in June 2026 delivered its most powerful demand signal of the entire recovery cycle. Buyer transactions surged 9.4% year-over-year — accelerating sharply from the 6.3% gain recorded in May. Furthermore, the GTA housing market price discount is actively narrowing: from −4.6% year-over-year in May to −3.9% in June. The recovery is not approaching — it is already here. Moreover, the GTA housing market continues to face a supply constraint that is simply not resolving. New listings remain 12.9% below last year — and the sales-to-new-listings ratio rose 8% year-over-year. Consequently, the fundamental supply-demand imbalance driving GTA housing market price recovery is intensifying, not easing. Additionally, days on market for properties is now flat year-over-year, confirming the correction period is definitively over. What This Report Covers: Your Complete June 2026 GTA Housing Market Breakdown Below, I break down every KPI from the TRREB June 2026 Quick Market Overview — residential, commercial, condo, and rental — with clear, actionable guidance for GTA housing market buyers and sellers. Additionally, each section includes a direct month-over-month comparison to May 2026 so you can see the direction of momentum, not just the snapshot. 📅 Published: July 7, 2026 · ✍️ A. Q. Mufti, Sales Representative · RE/MAX Real Estate Centre Inc., Brokerage · 📍 Mississauga, GTA · ⏱ 9 min read Watch: June 2026 GTA Housing Market Update Prefer to watch? This 2-minute video covers the three biggest June 2026 GTA housing market signals and what they mean for your next move. TRREB JUNE 2026 · A. Q. MUFTI +9.4% TRANSACTIONS YOY -12.9% NEW LISTINGS YOY -3.9% AVG PRICE YOY +8% SALES/LIST RATIO 0% DOM — FLAT (FLOOR) GTA Housing Market Update — June 2026 A. Q. Mufti · RE/MAX Real Estate Centre Inc. · 2 min 30 sec ℹ To activate: record a 2–3 min walkthrough of the data below and paste your YouTube or Vimeo embed code where the play button sits above. 📊 Residential Market Snapshot June 2026 GTA Housing Market: Eight Numbers That Define the Recovery Each metric drawn directly from the TRREB June 2026 Quick Market Overview — compared to May 2026 to show the momentum. Transactions YoY +9.4% ↑ Accelerating ↑ from +6.3% in May Strongest year-over-year gain of 2026. GTA housing market demand is accelerating, not plateauing. SA Transactions MoM +1.4% ↑ Sustained growth A fourth consecutive month of SA transaction gains. The trend is structural, not seasonal. Average Price YoY −3.9% ↓ Narrowing discount Was −4.6% in May Discount is closing. Each month of delay costs buyers more. Act before it reaches zero. SA Price MoM +0.1% ↑ 4th month rising Four consecutive months of SA price gains — the longest recovery streak of this cycle. New Listings YoY −12.9% ↓ Supply constrained Easing from −18.9% May Supply recovering slightly but still far below last year. Demand exceeds available homes. Sales/List Ratio YoY +8% ↑ Tightest of 2026 ↑ from +6% in May More sales relative to listings than any prior month this year. Classic pre-price-surge pattern. DOM — Property YoY 0% = Floor confirmed ↓ from +7.7% in May Days on market is now flat year-over-year. The correction period is definitively over. DOM — Listing YoY +11.5% Watch this space Listings slightly extended vs last year — but the property DOM signal of 0% is the more meaningful indicator. “Transactions accelerated to +9.4% YoY in June while the price discount narrowed to −3.9%. The GTA housing market sales-to-new-listings ratio hit +8% — the tightest of 2026. Days on market is now flat. Every indicator is pointing the same direction: prices are going up. The only question is whether you act before or after they do.” June 2026 GTA Housing Market — Full Data at a Glance The infographic below summarizes all key June 2026 TRREB metrics. Furthermore, it shows the month-over-month improvement from May — confirming the GTA housing market recovery is gaining momentum, not stalling. GTA HOUSING MARKET · JUNE 2026 · TRREB MARKET DATA Analysis by A. Q. Mufti · RE/MAX Real Estate Centre Inc., Brokerage · aqmuftirealty.com · 416 908 5600 Transactions YoY +9.4% ↑ was +6.3% Sales/List Ratio YoY +8% ↑ was +6% SA Transactions MoM +1.4% SA Price MoM +0.1% Avg Price YoY −3.9% ↑ was −4.6% New Listings YoY −12.9% ↑ was −18.9% DOM Property YoY 0% FLAT ✓ Condo Price QoQ −9.1% Condo Rentals QoQ +10.6% 5 KEY SIGNALS 1 Demand accelerating +9.4%Strongest gain of 2026 2 Price discount closing−3.9% vs −4.6% in May 3 DOM flat — floor confirmed0% YoY — correction over 4 4 months SA price gainsLongest streak this cycle 5 Condos deepest discount−9.1% price · +10.6% rentals JUNE vs MAY 2026 — THE MOMENTUM Transactions: +6.3% → +9.4% ↑ Sales Ratio: +6% → +8% ↑ Price Gap: −4.6% → −3.9% ↑ accelerating tightening closing fast Source: TRREB Quick Market Overview June 2026 · A. Q. Mufti · RE/MAX Real Estate Centre Inc. · 416 908 5600 · aqmuftirealty.com Figure 1: TRREB June 2026 GTA housing market data summary with May 2026 comparison