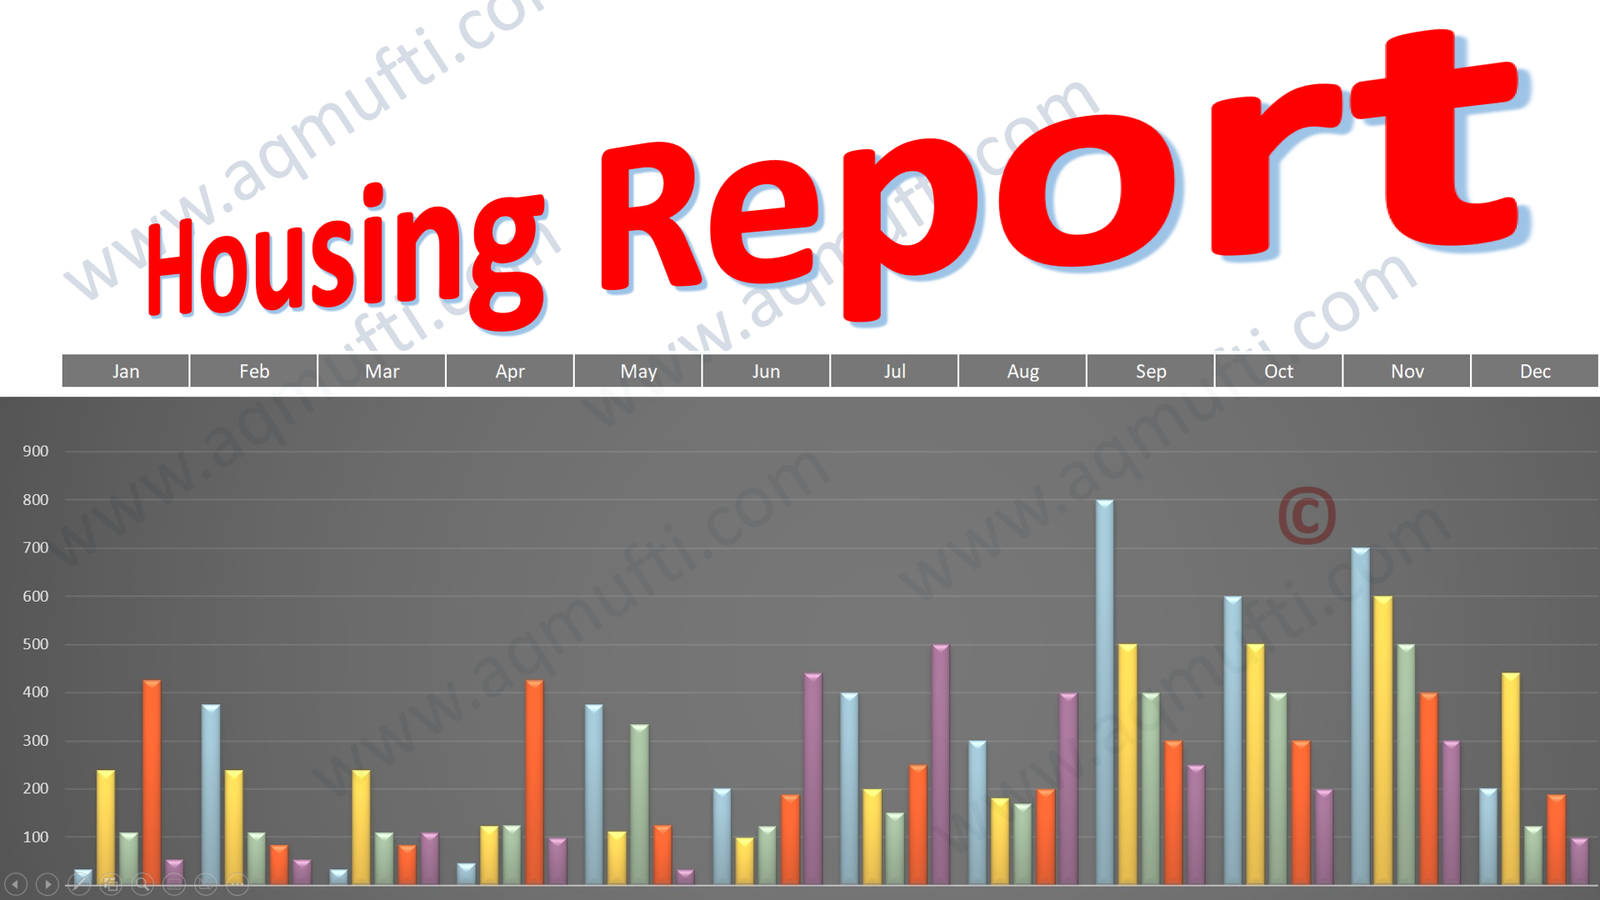
The Toronto Regional Real Estate Board (TRREB) has released its October 2022 housing report, and here is a quick review for your benefit. In short, sellers held back, sales slowed sharply and prices began to level off.
This review covers TRREB’s October 2022 report. The figures below are from that month.
October 2022 housing report: sellers held back
Sellers were holding tight to their properties. As a result, there were 11.6% fewer new listings on the market compared with last year.
The market also felt a squeeze on overall activity. Total transactions fell by almost 50% compared with the same month last year. Compared with September, though, they saw a negligible increase of 0.1%.
So the year-over-year drop was steep, while the month-to-month picture held steady. When both sales and listings fall together, the market often pauses rather than crashes. Buyers and sellers wait to see what happens next.
Days on market and the sales-to-new-listings ratio
Homes also took longer to sell, as the days-on-market figures below show. Meanwhile, the sales-to-new-listings ratio took a hit, with 35% fewer sales during the period.
The average number of days a listing stayed on the market rose by 61.5%. That is, it went from 13 days last year to 21 days in October 2022. In the October 2022 housing report, this was one of the clearest signs of a cooler market.
For sellers, longer selling times mean the first two weeks of a listing matter a lot. Good photos, a fair price and easy showings help a home stand out. For buyers, more time on the market can mean more room to negotiate and fewer bidding wars.
Average selling price starts to plateau
The average selling price saw a further decline of almost 6% compared with the same period last year. However, it is interesting to note that the selling price was forming a plateau. There was no change month over month, from September to October this year.
A flat month does not guarantee a turning point. Still, the October 2022 housing report hinted that the steep price declines were slowing down. Buyers who had waited on the sidelines started to pay closer attention.
If you plan to sell, a flat price trend is a good time to get a clear, realistic valuation. If you plan to buy, it is a good time to get a mortgage pre-approval, so you can act quickly when the right home appears. Either way, local data for your own neighbourhood matters more than the average for the whole region.
Condo sales and rents in the October 2022 housing report
Overall, condominium sales followed the trend set by home sales, except for price. Condo prices rose 4.5% compared with last year in Q3.
Condo inventory fell 16% compared with Q3 2021, while sales were down 46.4%. Condos also took more time to sell, a 31.6% increase. That is 25 days, compared with 19 days in Q3 2021.
Why would condo prices rise while sales fell? One likely reason is that condos were the most affordable entry point for many buyers. When borrowing costs rise, buyers often shift toward smaller homes. So demand for condos can hold up better than demand for larger detached houses, even in a slower market.
Condo rentals
Condo rental inventory saw a squeeze, with 17.3% fewer units available to rent. As a result, the average one-bedroom apartment rent went up by 20.4%, from $2,061 last Q3 to $2,481 this quarter.
For investors, strong rents supported the case for owning a rental condo. For renters, however, tight supply meant higher costs and fewer choices.
Commercial sales and leasing rates
Commercial sales took a hit of 42.3%, while leasing activity fell by 12.7%. Even so, the October 2022 housing report showed lease rates rising across the board:
- The average industrial leasing rate went up 20.3% to $13.33 per square foot.
- The average commercial and retail rate rose 32.4% to $26.58 per square foot.
- The average office leasing rate saw a 17.5% uptick to $18.81 per square foot.
In other words, fewer deals closed, yet the deals that did close came at higher rates. For small business owners in Mississauga, that is a reminder to review lease terms carefully before renewing.
Reading the October 2022 housing report today
A lot has changed since then. Interest rates, prices and buyer demand have all moved a great deal. So please treat the October 2022 housing report as a snapshot of one month, not as a guide to today’s prices. Still, the patterns it shows, such as how listings, days on market and prices move together, can help you read any market report.
To see how the market moved afterwards, compare this review with my February 2023 market analysis and my July 2023 review. You can find TRREB’s full monthly reports on the TRREB website.
There is always a better solution a professional can provide, sometimes beyond what one might think of alone. A local agent can show you what the numbers mean for your street, your building and your budget.
Talk to a Mississauga real estate agent
Do you have questions about buying, selling or simply planning your next move in Mississauga or the GTA? I am happy to help, so please send me a message or call me at 416 908 5600. If you found this review helpful, I would greatly appreciate a Google Review for my real estate services. Thank you for your continued support. A. Q. Mufti, Sales Representative, RE/MAX Real Estate Centre Inc., Brokerage
Disclaimer: this article was published on 18 January 2025 and reflects the information available at that time. Interest rates, prices, and government programs change, so check the current position before acting on anything here. It is provided for information only and is not financial, mortgage, tax or legal advice. A. Q. Mufti is a registered Sales Representative with RE/MAX Real Estate Centre Inc., Brokerage, Ontario, Canada.