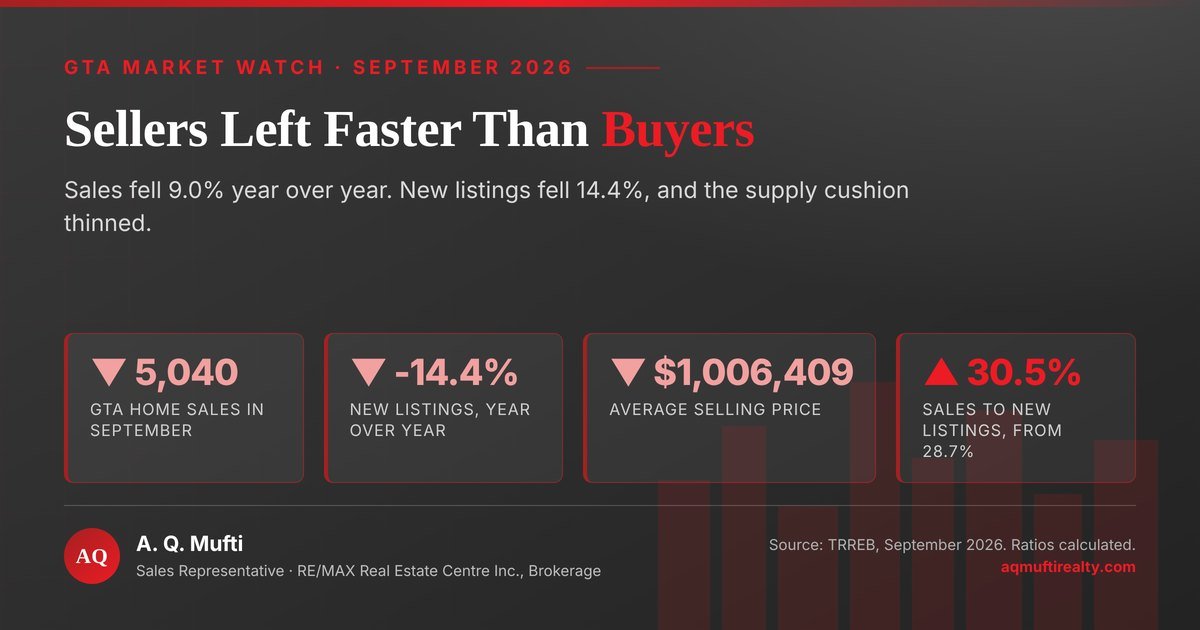
September GTA home sales, at a glance. Source: TRREB, September 2026. Ratios calculated.
One number in last week’s board report deserves more attention than the headline did. September GTA home sales fell 9.0% against a year earlier, which reads like a slow market.
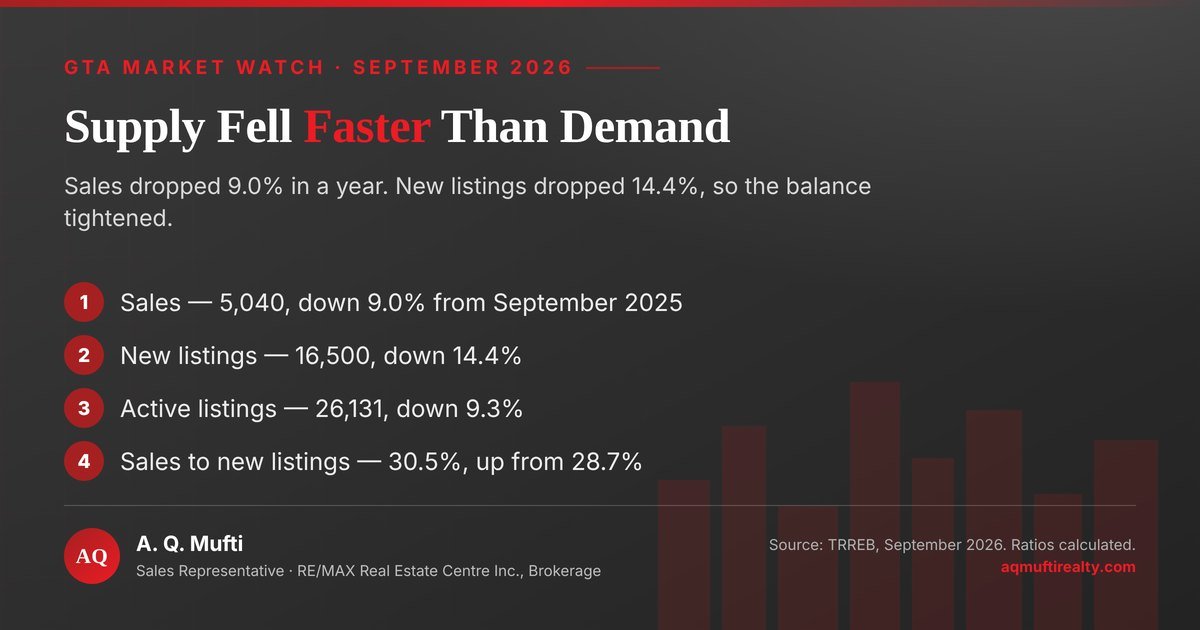
Meanwhile the supply side fell harder. New listings dropped 14.4%, so sellers left the market faster than buyers did. Therefore the market quietly tightened in a month that looked weak.
The short version
- Sales slipped, supply slipped more. First, GTA home sales came in at 5,040, down 9.0%. New listings fell 14.4%, to 16,500.
- The ratio moved the other way. Consequently 30.5% of new listings sold, against 28.7% a year ago (calculated). That is a tighter market, not a looser one.
- Prices are back above a million. The average selling price was $1,006,409. Still, that is 5.1% below last September.
- Buyers keep a cushion for now. Active listings stood at 26,131, worth 5.18 months of sales. A year earlier the figure was 5.20 months.
- Two October dates matter. Notably, the Bank of Canada reports on October 28 and Ontario votes municipally on October 26.
September GTA home sales in numbers
First, here is the month beside the same month last year. The GTA home sales line is the one most reports led with. The listings line is the one that moved further.
| September measure | 2026 | 2025 |
|---|---|---|
| Home sales | 5,040 | 5,540 |
| New listings | 16,500 | 19,270 |
| Average price | $1,006,409 | about $1,060,500 |
| Active listings | 26,131 | about 28,810 |
| Sales to new listings | 30.5% | 28.7% |
What September GTA home sales actually showed
Start with the four figures the board published, because the story sits inside them rather than beside them.
The four GTA home sales numbers that matter
First, sales reached 5,040 across the region, down 9.0% from September 2025. New listings came to 16,500, down 14.4%. The average selling price was $1,006,409, down 5.1%. Finally, the MLS Home Price Index composite fell 4.7%.
So two of those four are demand measures and one is supply. Generally a reader stops at the first one and concludes the market is soft. However, the second one carries the better signal this month.
Still, TRREB framed the month as a holding pattern. Jason Mercer, its chief information officer, pointed past it. “We know there is substantial pent-up demand in the GTA, with many households fully intending on purchasing a home in the months ahead,” he said in the September release.
Why new listings matter more than GTA home sales
Here is the mechanic that decides prices. Generally a market sets prices from the balance between the two sides, not from the sales count alone.
In practice, about 500 fewer homes sold this September than last. Meanwhile 2,770 fewer came onto the market. The withdrawal on the selling side was more than five times the size.
A ratio that moved the other way
Now divide one by the other and the direction flips. September GTA home sales absorbed 30.5% of new listings, against 28.7% a year earlier (both calculated).
Admittedly that is a small move, and it points the other way from the headline. Consequently a market described as quiet was slightly firmer than the same month in 2025.
Besides, sellers read the same conditions buyers do. Hence many chose not to list at all this fall, which is exactly how a thin market turns into a competitive one later.
Inventory still favors buyers, but less than it did
Next, look at what is standing on the shelf rather than at what moved off it. Active listings are the cushion a buyer negotiates against, and GTA home sales are the rate at which that cushion empties.
What GTA home sales look like against supply
Active listings finished September at 26,131, down 9.3%. Measured against the month’s sales that is 5.18 months of inventory, while a year earlier the figure was 5.20 months.
Five months is still a buyer’s number in this region. Therefore nobody needs to rush an offer this month on supply grounds alone, because that shelf is still deep.
Nevertheless the trend is the point. Supply shrank by almost a tenth in a year while the cushion barely moved, because sales shrank too. Equally, the next leg depends on which side returns first.
What September did to prices
Prices behaved oddly this month, and the explanation is worth two minutes. Although GTA home sales fell, the average price climbed.
Above a million, and still below last year
Firstly, the average selling price crossed back over $1 million, at $1,006,409. Yet it sat 5.1% below September 2025, which works out to roughly $54,000 less (calculated).
Unadjusted, that average also rose about 1.3% from August’s $993,410 (calculated). On a seasonally adjusted basis, though, TRREB reports that both the average price and the composite index edged lower.
Why GTA home sales and prices moved apart
Averages shift with the mix as well as with value. So a quieter month at the entry level lifts the average without lifting any single home’s worth. Fewer GTA home sales in the condo range do exactly that.
Hence the index exists for that reason. It fell 4.7%, which is the cleaner read on what a comparable home is worth today. Afterward, treat the average as a budgeting figure and the index as a value figure.
Two October dates that could move GTA home sales
Meanwhile two events land in the next three weeks, and both touch the cost of buying here.
The rate decision on October 28
The Bank of Canada has held its policy rate at 2.25% since September 2. Its next announcement arrives on October 28, with a Monetary Policy Report attached.
Notably, a Monetary Policy Report matters more than a plain announcement. Besides the decision itself, it publishes the Bank’s own forecast, which is what fixed mortgage pricing reacts to.
The municipal vote on October 26
Secondly, Ontario votes municipally on Monday, October 26. Housing costs are on the ballot in a direct way this time.
Furthermore, TRREB has asked candidates across the region to reject a municipal land transfer tax outside Toronto. Its chief executive, John DiMichele, put the board’s position in the September release: “Governments must make homeownership more attainable by reducing barriers such as Toronto’s Municipal Land Transfer Tax and opposing its expansion across the GTA and Simcoe County.”
Similarly, Daniel Steinfeld, the board’s president, framed the stakes the same way. “Housing is one of the biggest issues on voters’ minds, and the upcoming municipal election will help shape housing policy across the GTA and Simcoe County for the next four years,” he said.
How to use September GTA home sales in a decision
Ultimately a monthly report is only useful if it changes what you do this month. So here is what September GTA home sales should change, on each side of the table.
If you are buying
- Shop the thin market, not the headline. Fewer listings means fewer choices, so widen the search area before you widen the budget.
- Price the index, not the average. A comparable home is worth about 4.7% less than a year ago. That is the number to negotiate from.
- Test the payment at your real ceiling. Run the figure through my payment calculator at the price you can close on, not your pre-approval.
- Decide before the rush, not during it. Pent-up demand returning into thin supply is how competition comes back. Afterward the discount goes with it.
If you are selling
- Count your competition, not the sales total. Active listings are down 9.3%, so your home faces fewer rivals than it would have last fall.
- Price to the current index. Last year’s comparable sale is 4.7% stale. My home valuation page sets the realistic number.
- Weigh fall against spring honestly. Spring brings more buyers and also more sellers. Neither season wins automatically.
Want the whole sequence in writing? For instance, my step-by-step guide for buyers runs from pre-approval to keys, and the monthly market updates track every figure above as it changes.
Your GTA home sales questions
Short answers to what buyers and sellers are asking me this month.
Are GTA home sales recovering?
Not yet on the sales count. September GTA home sales fell 9.0% from a year earlier. However, new listings fell 14.4%, so the balance between the two sides tightened.
Why did new listings fall faster than sales?
Because sellers read soft conditions and chose to wait. That withdrew 2,770 homes from the market against 500 fewer sales, which is why the ratio of sales to listings rose.
Is $1,006,409 a realistic price for Mississauga?
Not by itself. It is the regional average across every home type, so it overstates a condo and understates a detached house. Ask for comparable sales in the specific area and type you are shopping.
Should I wait for the October rate decision?
The Bank of Canada reports on October 28 with a Monetary Policy Report. Waiting three weeks costs little, but remember that cheaper money usually brings more competition with it.
What does 5.18 months of inventory mean?
Simply, it is how long the standing listings would last at September’s pace of sales. Around five months is a balanced to buyer-leaning market in this region.
Sources and further reading
- TRREB – September 2026 — the month
- TRREB – August 2026 — last month
- TRREB – election — the ask
- Bank of Canada – rate — 2.25%
- Bank of Canada – dates — Oct 28
- Mississauga – vote — Oct 26
Keep reading on the blog
More market analysis and guides from this blog.
- GTA Home Prices, August 2026 — last month
- Land Transfer Tax in the GTA — the vote
- Conditional Offers in Ontario — offer terms
- Closing Costs in Ontario — the extras
Ready to put these numbers against your own move?
Send me the area and price range you are watching and I will put September’s figures beside the comparable sales that actually apply to it, buying or selling. No pressure, and no obligation.
Prefer to start with a number? Get a tailored home valuation or run the figures in the mortgage calculator.
Disclaimer: This article draws on TRREB’s September and August 2026 market releases, on TRREB’s September 2026 municipal election statement and on the Bank of Canada. It offers information only. I calculated the ratios, the 2025 price and active-listing figures and the month-over-month change from those published numbers. Market figures move monthly, so confirm the current ones before you act. Nothing here is financial, mortgage, tax or legal advice. A. Q. Mufti – Sales Representative, RE/MAX Real Estate Centre Inc., Brokerage.
A. Q. Mufti — Sales Representative
RE/MAX Real Estate Centre Inc., Brokerage
MSc, PMP®, ABR®, SRS®, CNE®
416 908 5600 · 905 270 2000
info@aqmuftirealty.com
141-1140 Burnhamthorpe Rd. W., Mississauga ON L5C 4E9
Serving Mississauga, Oakville, Milton, Brampton, Toronto and the wider GTHA. More about how I work.