
The GTA Buying Window Is Open — But Not Forever
Prices are 5.2% lower than a year ago. Transaction volume just surged 30.7%. History says the U-turn is coming — here is the data that tells you exactly why smart buyers are acting right now.
Every seasoned investor knows the rule: you don’t buy at the top of euphoria — you buy when the crowd is hesitant and the data quietly signals a turn. The TRREB March 2026 report is one of those moments. Prices have pulled back from their peak. Sellers have conceded ground. And the buyers who trust the numbers, not the noise, are already writing offers.
Below, I’ve dissected every line of the March 2026 TRREB Market Report and translated it into plain-language insight for my clients. Whether you’re a first-time buyer, a move-up buyer, or an investor, this analysis is built for you.
📅 Published: April 13, 2026 · ✍️ By A.Q. Mufti, REALTOR® · 📍 Mississauga, GTA · ⏱ 8 min read
March 2026 by the Numbers
Six metrics that paint the clearest picture of where the GTA market stands — and where it’s heading.
Month-over-Month Momentum
March vs. February 2026 — the direction of travel is clear.
What the Data Is Really Telling You
Prices Have Found Their Floor
The median price climbed 2.0% from February to March 2026 — the first meaningful month-over-month increase in this correction cycle. When the bottom starts holding, recovery follows. This is the moment before the window closes.
Maximum Inventory, Maximum Choice
New listings surged 43.7% month-over-month to 31,476 — the highest supply of 2026 so far. Buyers today have the widest selection of homes at the lowest prices of the current cycle. This dual advantage won’t last.
Transactions Exploding — Demand Is Back
10,928 transactions in March — up 30.7% from February. Other buyers have already done the math. When transaction volume spikes this sharply before a sustained price recovery, it signals the turning point with high reliability.
Properties Selling Faster
Median days on market dropped to just 23 days — down 8% from February. Homes are moving. The narrative of “nobody is buying” simply does not match the data. The active buyers are competing; the passive ones are watching.
Sale-to-List Ratios Strengthening
Average SP/LP ratio rose to 98.0% from 97.5% — sellers are recovering pricing power. Meanwhile, only 18.1% of homes still sell above asking. Act before that number climbs back toward the 24%+ we saw last year.
YTD Prices Still 5.6% Below Last Year
Year-to-date average prices are $812,011 vs. $859,908 last year — a $47,000 discount. For every month you delay, you risk buying that same home for $40-50K more as the recovery solidifies and competition returns.
Now vs. Last Year vs. YTD
The full picture — every major KPI compared across timeframes.
| Metric | Mar 2026 (Now) | Mar 2025 (YoY) | YoY Change |
|---|---|---|---|
| Average Sale Price | $823,467 | $868,446 | ↓ 5.2% — Buy at discount |
| Median Sale Price | $700,000 | $737,000 | ↓ 5.0% — Save $37K vs. last yr |
| Transaction Volume | 10,928 | 11,061 | ↓ 1.2% — Near-parity, demand back |
| New Listings | 31,476 | 34,421 | ↓ 8.6% — More demand per listing |
| % Above List Price | 18.1% | 24.3% | ↓ 25.4% — Less bidding war risk |
| % Below List Price | 77.0% | 69.7% | ↑ 10.5% — Negotiating power is yours |
| Avg Days on Market | 40 | 35 | ↑ 15% — Time to decide thoughtfully |
| Avg SP/LP Ratio | 98.0% | 99.1% | ↓ 1.1% — Offer under asking, win deals |
| Median Days on Market | 23 days | 20 days | ↑ 15% — Less pressure, more clarity |
Where Is the Needle Right Now?
77% of homes sell below ask. Conditions favour negotiation.
Balanced market is typically 2–3 months. We’re at the edge — act now.
5 Reasons the Window Is Closing
Every correction in Canadian real estate history has reversed. Here is exactly why 2026 Q1–Q2 is the inflection point.
Rate Cuts Are Here
The Bank of Canada has been reducing rates — lower borrowing costs directly translate into higher purchasing power and renewed demand that pushes prices up.
Transaction Volume Already Spiking
A 30.7% MoM jump in sales means the crowd is already moving. In past cycles, this level of volume re-entry preceded 15–20% price appreciation within 12–18 months.
Population Growth Unchanged
Canada adds 400,000+ new permanent residents annually. The GTA absorbs the majority. Structural demand for housing has not changed — only the sentiment has.
Median Price Already Rising
Median price climbed 2.0% from February to March alone. The floor may be in. Waiting another quarter could mean buying at $730K instead of $700K — a $30K premium for hesitation.
Days on Market Compressing
Average DOM fell from 46 to 40 days in one month. Median DOM is just 23 days. Inventory is being absorbed faster — the choice you have today won’t exist by summer.
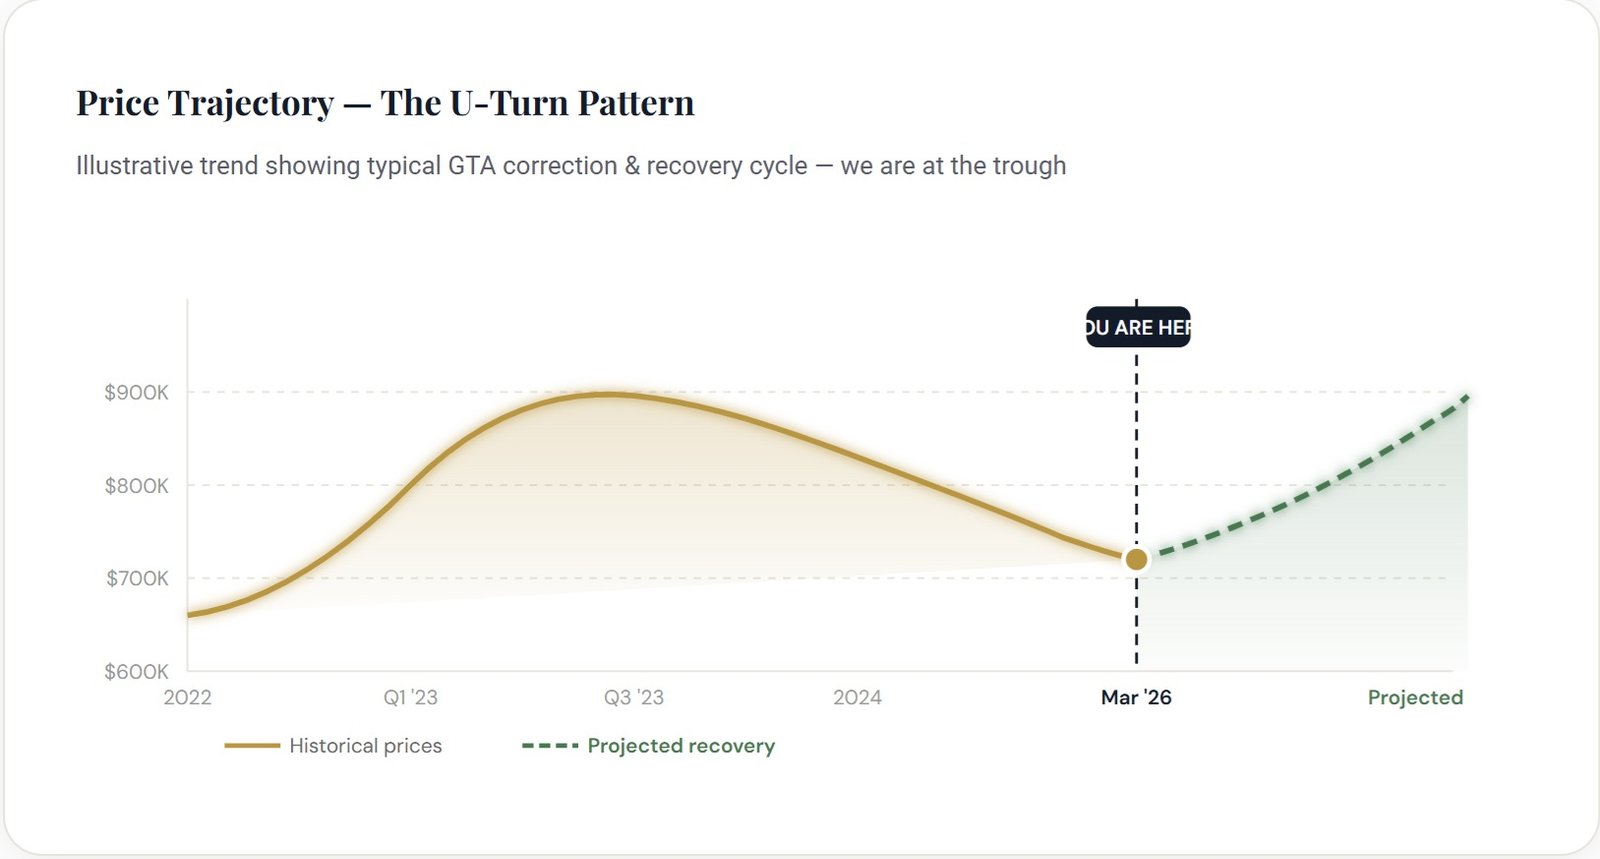
The GTA Correction & Recovery Playbook
History doesn’t repeat, but it rhymes — and the rhyme scheme is very recognizable.
Phase 1 — Peak & Rate Shock (2022)
Prices hit all-time highs. Rate hikes begin. Sentiment cools sharply. Volume drops. Headlines scream “crash.”
Phase 2 — Correction (2023–2024)
Average prices fall 15–20% from peak. Days on market extend. Sellers reduce. Inventory rises. Fear is maximum. This is also when the best deals are made.
Phase 3 — Accumulation / Base (NOW — Early 2026)
Prices stabilize. Transactions re-accelerate. Volume surges. Smart money enters. Days on market start falling. Median price makes first MoM gain. This is exactly where March 2026 data puts us.
Phase 4 — Recovery & New Run (2026–2027, Projected)
Rates stabilize lower. Immigration-driven demand re-engages. Competition returns. Bidding wars re-emerge. Prices recover toward prior peaks and beyond. Those who bought in Phase 3 benefit most.
“The time to buy real estate is when nobody wants it — and the data says that moment is right now in the GTA.”— A.Q. Mufti, REALTOR® · aqmuftirealty.com
What This Means If You’re Selling
The 43.1% spike in terminations this month tells a story: overpriced listings are being withdrawn. Sellers who price strategically — anchored to real comps, not wishful thinking — are selling in 23 days at 98% of asking. The market rewards precision, not ambition.
Here is what a smart seller does right now:
Price to the Median
List at or just below the $700K median and you attract the most buyer demand in the current market. Overpricing into the top 25% gets you into termination territory.
Timing Is Your Friend Now
Spring market is arriving. With inventory rising and buyers flooding back, a well-presented, properly priced home listed in April–May 2026 will benefit from seasonal demand.
Negotiate From Strength
97.5% YTD average SP/LP ratio means sellers who price correctly receive near-full-asking offers. Position correctly and you aren’t leaving money on the table.
Questions Buyers Are Asking Right Now
Is now actually a good time to buy in Mississauga?
Yes — with significant nuance. Median prices are 5% below last year, you have maximum negotiating leverage (77% of homes sell below asking), and transaction volume is accelerating sharply. The combination of lower prices, softer competition, and rising demand signals this is near the optimal entry point of the current cycle.
Will GTA home prices go down further in 2026?
Possibly modestly — but the March 2026 data strongly suggests a floor is forming. Median prices rose 2% month-over-month for the first time this cycle. More importantly, the risk of waiting is asymmetric: if prices recover (as history shows they do), buyers who waited miss significant appreciation. The expected upside outweighs the risk of a small further dip.
What type of property offers the best value in the current market?
Properties priced below the $700K median threshold — particularly townhomes, semi-detached, and condos with outdoor space — represent the strongest value. These attract the widest buyer pool on the way back up, maximizing resale appreciation. Contact A.Q. Mufti for a personalized analysis based on your budget.
How much can I negotiate off the asking price right now?
With 77% of homes selling below list and an average SP/LP of 98%, there is typically 2–5% room for negotiation on well-priced homes. On overpriced or sitting listings, discounts of 5–10% are achievable. Your realtor’s negotiation strategy makes a significant difference — this is exactly where working with an experienced agent like A.Q. Mufti pays for itself many times over.
Ready to Buy at the Bottom of the Cycle?
Don’t wait for the headlines to confirm what the data already shows. Book a free, no-obligation strategy session with A.Q. Mufti and get a personalized market analysis for your situation.
⭐⭐⭐⭐⭐ Rated 5.0/5 on Google · 47 verified reviews · Serving GTA & Mississauga since 2009
📌 Disclaimer: This market analysis is based on TRREB data for March 2026 and is for informational purposes only. It does not constitute financial or legal advice. Past market performance does not guarantee future results. Always consult a licensed professional before making real estate decisions. A.Q. Mufti is a registered REALTOR® in Ontario, Canada.